## Stacked Bar Chart: Self-Rewarding vs. SFT Baseline Wins
### Overview
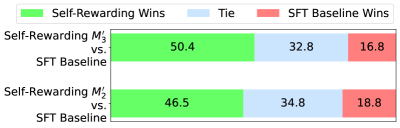
The image is a stacked bar chart comparing the performance of two self-rewarding models (M'3 and M'2) against an SFT Baseline. The chart shows the percentage of wins, ties, and SFT Baseline wins for each comparison.
### Components/Axes
* **Y-axis Labels:**
* Self-Rewarding M'3 vs. SFT Baseline
* Self-Rewarding M'2 vs. SFT Baseline
* **X-axis:** Implicitly represents the percentage of outcomes (Wins, Ties, SFT Baseline Wins).
* **Legend (Top):**
* Light Green: Self-Rewarding Wins
* Light Blue: Tie
* Light Red: SFT Baseline Wins
### Detailed Analysis
The chart presents two horizontal stacked bars, each representing a comparison between a self-rewarding model and the SFT Baseline. Each bar is divided into three segments representing the percentage of Self-Rewarding Wins, Ties, and SFT Baseline Wins.
* **Self-Rewarding M'3 vs. SFT Baseline (Top Bar):**
* Self-Rewarding Wins (Light Green): 50.4%
* Tie (Light Blue): 32.8%
* SFT Baseline Wins (Light Red): 16.8%
* **Self-Rewarding M'2 vs. SFT Baseline (Bottom Bar):**
* Self-Rewarding Wins (Light Green): 46.5%
* Tie (Light Blue): 34.8%
* SFT Baseline Wins (Light Red): 18.8%
### Key Observations
* Self-Rewarding M'3 has a higher percentage of wins (50.4%) compared to Self-Rewarding M'2 (46.5%).
* The percentage of ties is slightly higher for Self-Rewarding M'2 (34.8%) compared to Self-Rewarding M'3 (32.8%).
* The SFT Baseline wins a slightly higher percentage of games against Self-Rewarding M'2 (18.8%) compared to Self-Rewarding M'3 (16.8%).
### Interpretation
The data suggests that both self-rewarding models outperform the SFT Baseline in terms of win percentage. Self-Rewarding M'3 appears to be slightly better than Self-Rewarding M'2, as it has a higher win rate and a lower percentage of SFT Baseline wins. The tie percentages are relatively close between the two models. The chart demonstrates the effectiveness of self-rewarding techniques in improving performance compared to a standard SFT Baseline.