# Technical Data Extraction: Model Performance Comparison
## 1. Component Isolation
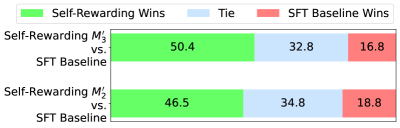
### Header (Legend)
Located at the top of the image, spanning the width of the chart.
- **Green Box:** Self-Rewarding Wins
- **Light Blue Box:** Tie
- **Red Box:** SFT Baseline Wins
### Main Chart (Horizontal Stacked Bar Chart)
The chart consists of two horizontal bars comparing different iterations of a "Self-Rewarding" model against an "SFT Baseline."
### Y-Axis Labels (Categories)
- **Top Bar:** Self-Rewarding $M'_3$ vs. SFT Baseline
- **Bottom Bar:** Self-Rewarding $M'_2$ vs. SFT Baseline
---
## 2. Data Table Reconstruction
The following table represents the numerical values extracted from the segments of the stacked bar chart. Values represent percentages (implied by the total sum of 100 per row).
| Comparison Category | Self-Rewarding Wins (Green) | Tie (Light Blue) | SFT Baseline Wins (Red) |
| :--- | :---: | :---: | :---: |
| **Self-Rewarding $M'_3$ vs. SFT Baseline** | 50.4 | 32.8 | 16.8 |
| **Self-Rewarding $M'_2$ vs. SFT Baseline** | 46.5 | 34.8 | 18.8 |
---
## 3. Trend Verification and Analysis
### Visual Trend Analysis
- **Self-Rewarding Wins (Green):** The green segment is the largest in both rows, indicating the Self-Rewarding models win more frequently than the baseline. The segment for $M'_3$ is visually longer than for $M'_2$.
- **Ties (Blue):** The blue segment is the second largest in both rows. It is slightly larger for $M'_2$ than for $M'_3$.
- **SFT Baseline Wins (Red):** The red segment is the smallest in both rows. It is slightly smaller for $M'_3$ than for $M'_2$.
### Key Findings
1. **Iterative Improvement:** The "Self-Rewarding" model shows improvement from iteration $M'_2$ to $M'_3$. The win rate increases from **46.5%** to **50.4%**.
2. **Dominance over Baseline:** In both iterations, the Self-Rewarding model significantly outperforms the SFT Baseline. In the $M'_3$ iteration, the win rate (50.4%) is exactly triple the baseline's win rate (16.8%).
3. **Reduction in Baseline Performance:** As the Self-Rewarding model iterates from $M'_2$ to $M'_3$, the SFT Baseline win rate drops from **18.8%** to **16.8%**, and the tie rate drops from **34.8%** to **32.8%**.