\n
## Stacked Bar Chart: Comparison of Self-Rewarding Models vs. SFT Baseline
### Overview
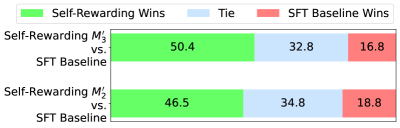
The image presents a stacked bar chart comparing the performance of two self-rewarding models (M¹₂ and M²₂) against an SFT Baseline. The chart visualizes the proportion of wins, ties, and losses for each model in comparison to the baseline. Each bar represents a comparison, and is divided into three segments representing "Self-Rewarding Wins", "Tie", and "SFT Baseline Wins".
### Components/Axes
* **Y-Axis:** Lists the two self-rewarding models being compared: "Self-Rewarding M¹₂ vs. SFT Baseline" and "Self-Rewarding M²₂ vs. SFT Baseline".
* **X-Axis:** Represents the percentage of outcomes, with no explicit scale markings but values ranging from 0 to approximately 50.
* **Legend:** Located at the top-left corner, defines the color coding:
* Green: Self-Rewarding Wins
* Light Blue: Tie
* Red: SFT Baseline Wins
### Detailed Analysis
The chart consists of two stacked bars, one for each model comparison.
**1. Self-Rewarding M¹₂ vs. SFT Baseline:**
* **Self-Rewarding Wins (Green):** Approximately 50.4%.
* **Tie (Light Blue):** Approximately 32.8%.
* **SFT Baseline Wins (Red):** Approximately 16.8%.
**2. Self-Rewarding M²₂ vs. SFT Baseline:**
* **Self-Rewarding Wins (Green):** Approximately 46.5%.
* **Tie (Light Blue):** Approximately 34.8%.
* **SFT Baseline Wins (Red):** Approximately 18.8%.
### Key Observations
* Both self-rewarding models (M¹₂ and M²₂) demonstrate a higher proportion of wins compared to the SFT Baseline.
* Model M¹₂ has a slightly higher win rate (50.4%) than Model M²₂ (46.5%).
* The proportion of ties is relatively similar for both models, around 33-35%.
* The SFT Baseline win rate is consistently lower for both comparisons, around 17-19%.
### Interpretation
The data suggests that both self-rewarding models outperform the SFT Baseline in this comparison. The higher win rates for the self-rewarding models indicate that they are more effective at achieving favorable outcomes against the baseline. The difference in win rates between M¹₂ and M²₂ suggests that M¹₂ is slightly more effective than M²₂. The consistent presence of ties indicates that there are scenarios where neither model nor the baseline achieves a clear win. The data does not provide information on the nature of the tasks or the criteria for determining a "win", "tie", or "loss". Further investigation would be needed to understand the specific strengths and weaknesses of each model and the reasons for the observed performance differences.