# Technical Document: Bar Chart Analysis
## Chart Title
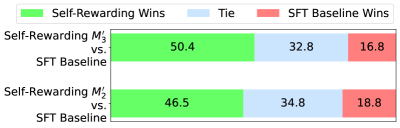
**Self-Rewarding Models vs. SFT Baseline Performance**
## Axes Labels
- **X-Axis**: Model Comparisons
- Subcategories:
1. `Self-Rewarding M₃ vs. SFT Baseline`
2. `Self-Rewarding M₂ vs. SFT Baseline`
- **Y-Axis**: Percentage (%)
- Range: 0% to 50% (increments of 10%)
## Legend
- **Colors**:
- `Green`: Self-Rewarding Wins
- `Blue`: Tie
- `Red`: SFT Baseline Wins
## Data Points
### Self-Rewarding M₃ vs. SFT Baseline
- **Self-Rewarding Wins**: 50.4%
- **Tie**: 32.8%
- **SFT Baseline Wins**: 16.8%
### Self-Rewarding M₂ vs. SFT Baseline
- **Self-Rewarding Wins**: 46.5%
- **Tie**: 34.8%
- **SFT Baseline Wins**: 18.8%
## Key Trends
1. **Self-Rewarding Wins Dominance**:
- Both models (`M₃` and `M₂`) outperform the SFT Baseline in "Self-Rewarding Wins" (50.4% and 46.5%, respectively).
- `M₃` achieves the highest "Self-Rewarding Wins" (50.4%), surpassing `M₂` (46.5%).
2. **Tie Frequency**:
- Ties are the second most common outcome for both models, with `M₂` having a slightly higher tie rate (34.8% vs. 32.8%).
3. **SFT Baseline Wins**:
- The SFT Baseline wins the least frequently (16.8% for `M₃`, 18.8% for `M₂`), indicating weaker performance compared to the Self-Rewarding models.
## Structural Notes
- The chart uses grouped bars to compare performance across two model configurations.
- Percentages sum to 100% for each model comparison (e.g., 50.4% + 32.8% + 16.8% = 100% for `M₃`).
- Color coding aligns strictly with the legend (green = Self-Rewarding Wins, blue = Tie, red = SFT Baseline Wins).