## Line Chart: Average Skip Rate across Similarity Thresholds — All Models
### Overview
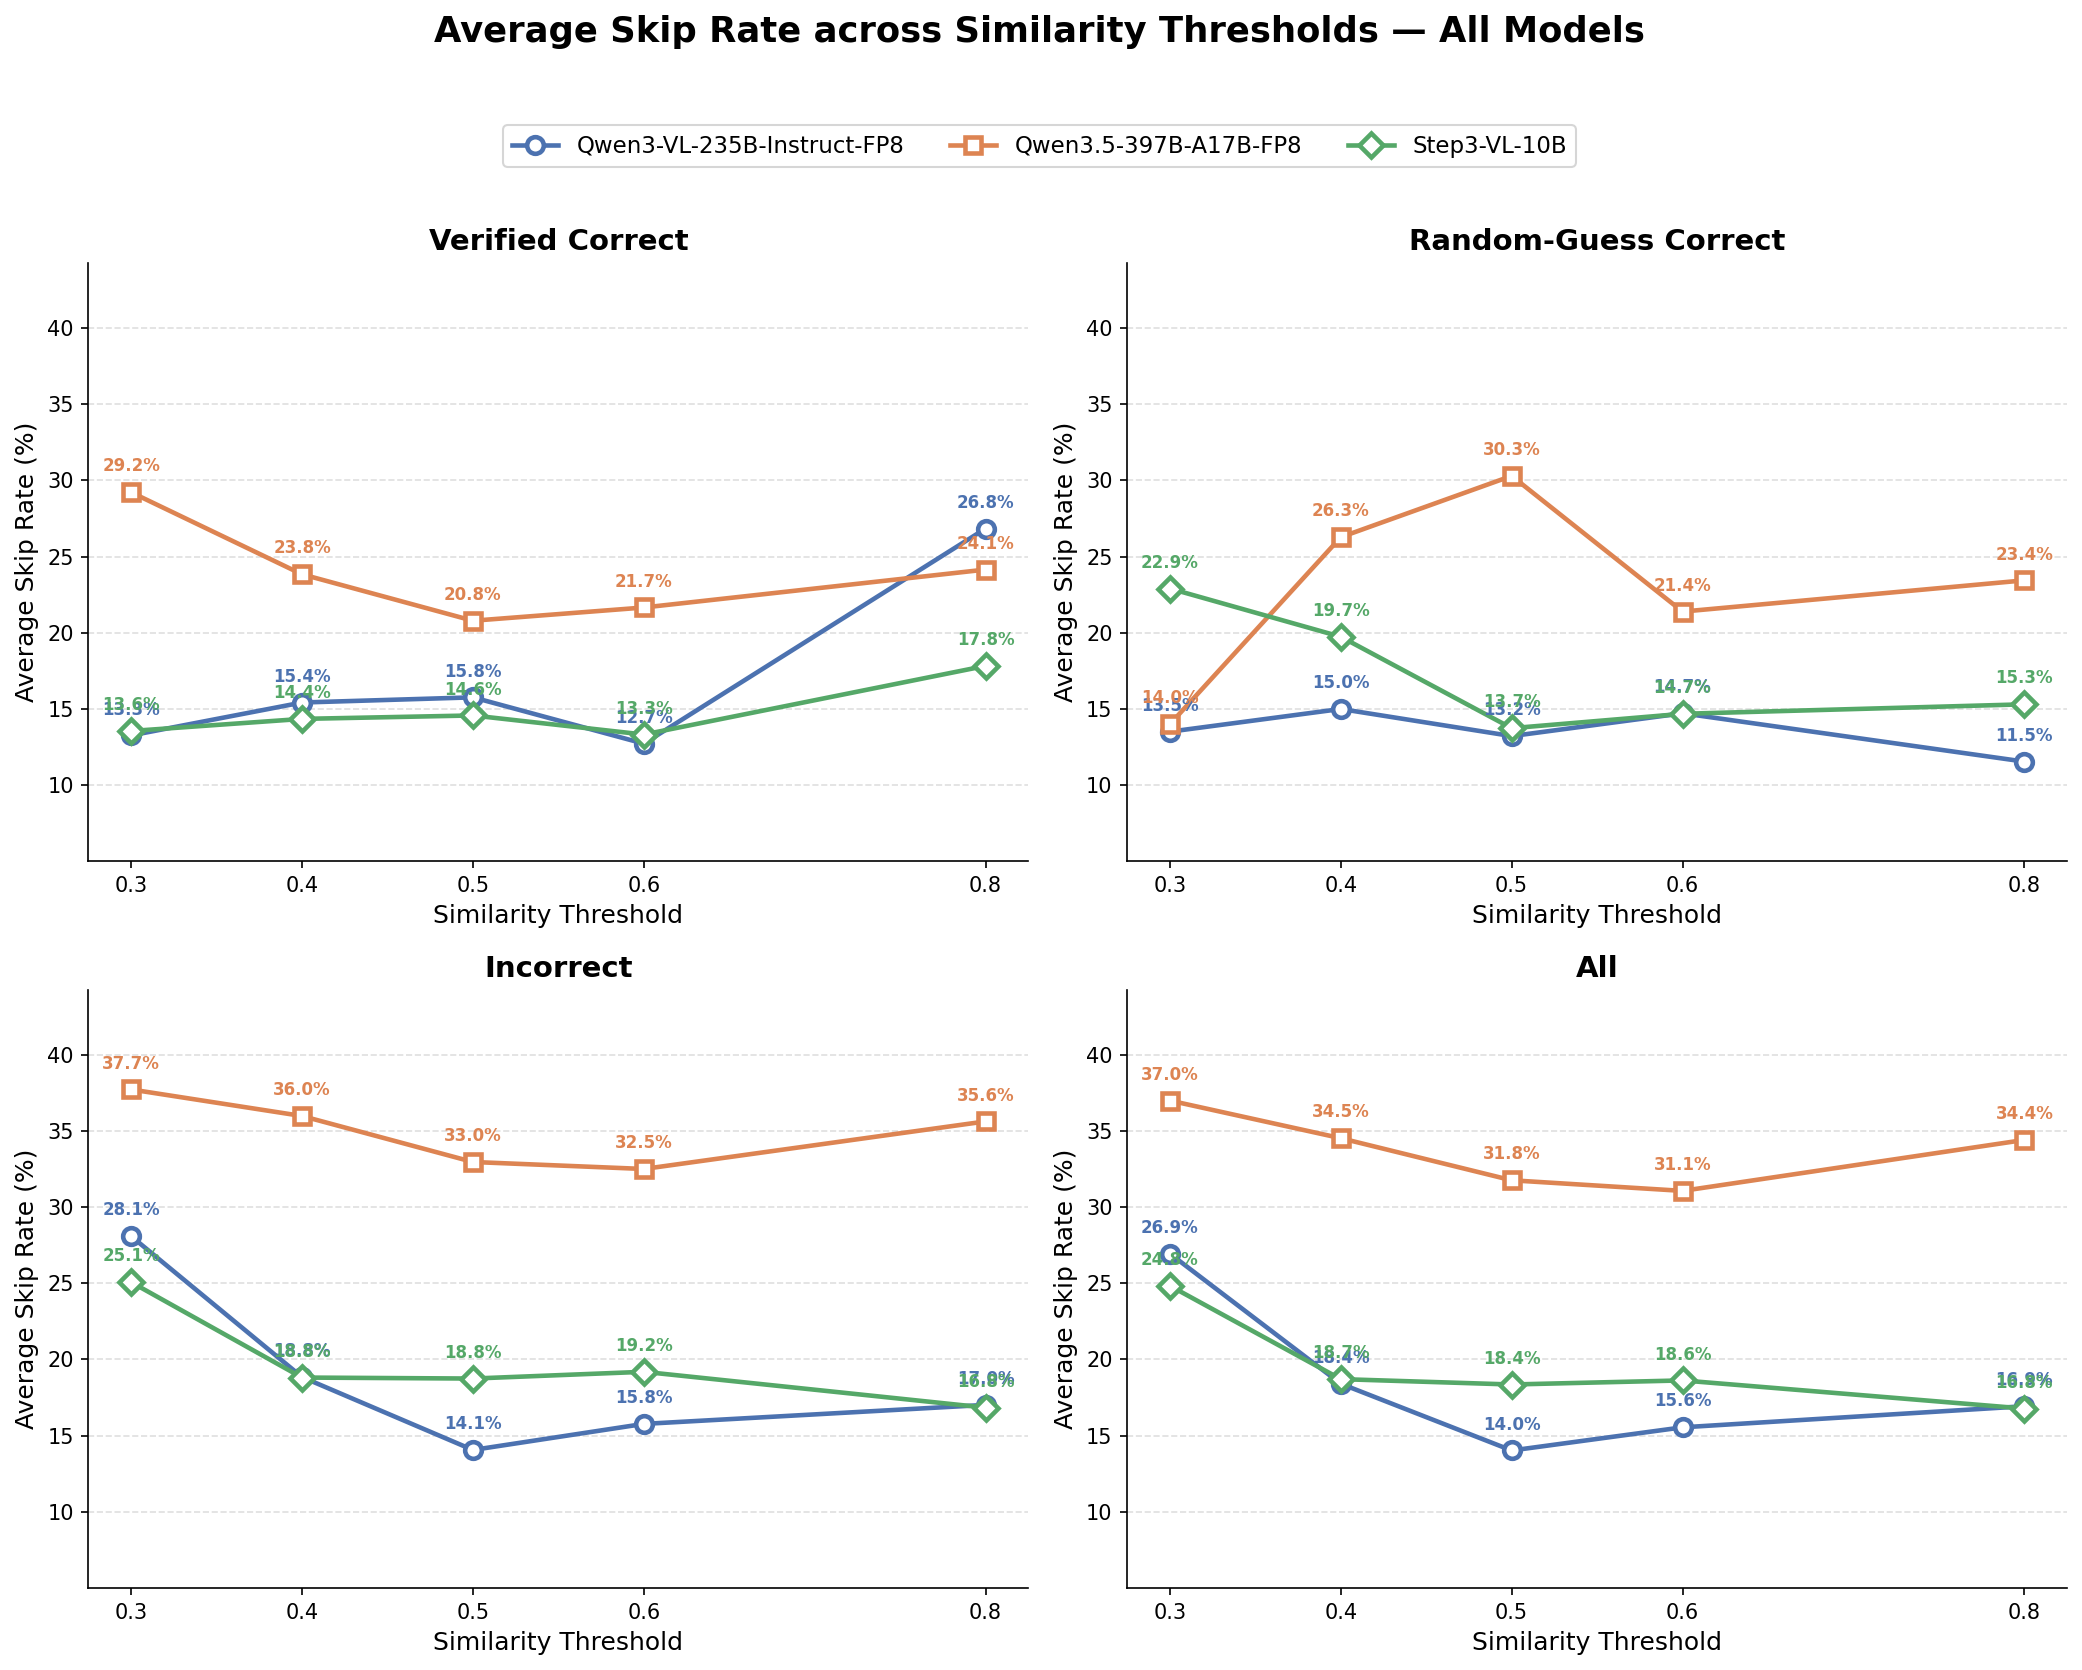
The image presents four line charts comparing average skip rates across different similarity thresholds (0.3–0.8) for three AI models: Qwen3-VL-235B-Instruct-FP8 (blue), Qwen3.5-397B-A17B-FP8 (orange), and Step3-VL-10B (green). Each subplot focuses on a specific evaluation category: Verified Correct, Random Guess Correct, Incorrect, and All. Data points are plotted with markers (circle, square, diamond) corresponding to the legend.
---
### Components/Axes
- **X-axis**: Similarity Threshold (0.3, 0.4, 0.5, 0.6, 0.8)
- **Y-axis**: Average Skip Rate (%)
- **Legend**: Located at the top, mapping colors/markers to models:
- Blue circle: Qwen3-VL-235B-Instruct-FP8
- Orange square: Qwen3.5-397B-A17B-FP8
- Green diamond: Step3-VL-10B
---
### Detailed Analysis
#### Verified Correct
- **Qwen3-VL-235B-Instruct-FP8 (blue)**: Starts at 13.9% (0.3), peaks at 26.8% (0.8), with a dip to 12.7% (0.6).
- **Qwen3.5-397B-A17B-FP8 (orange)**: Declines from 29.2% (0.3) to 20.8% (0.5), then rises to 24.1% (0.8).
- **Step3-VL-10B (green)**: Stable between 13.9% (0.3) and 17.8% (0.8), with a minor dip to 13.3% (0.6).
#### Random Guess Correct
- **Qwen3-VL-235B-Instruct-FP8 (blue)**: Peaks at 15.8% (0.5), drops to 11.5% (0.8).
- **Qwen3.5-397B-A17B-FP8 (orange)**: Rises from 14.0% (0.3) to 30.3% (0.5), then declines to 23.4% (0.8).
- **Step3-VL-10B (green)**: Declines from 22.9% (0.3) to 15.3% (0.8).
#### Incorrect
- **Qwen3-VL-235B-Instruct-FP8 (blue)**: Declines from 28.1% (0.3) to 16.9% (0.8).
- **Qwen3.5-397B-A17B-FP8 (orange)**: Declines from 37.7% (0.3) to 34.4% (0.8), with minor fluctuations.
- **Step3-VL-10B (green)**: Stable between 18.8% (0.4) and 24.9% (0.3), ending at 16.9% (0.8).
#### All
- **Qwen3-VL-235B-Instruct-FP8 (blue)**: Peaks at 26.9% (0.3), drops to 16.9% (0.8).
- **Qwen3.5-397B-A17B-FP8 (orange)**: Declines from 37.0% (0.3) to 34.4% (0.8).
- **Step3-VL-10B (green)**: Declines from 24.9% (0.3) to 16.9% (0.8).
---
### Key Observations
1. **Qwen3.5-397B-A17B-FP8 (orange)** consistently shows the highest skip rates across all categories, especially in "Verified Correct" and "All."
2. **Step3-VL-10B (green)** exhibits the most stable performance, with lower variability in skip rates.
3. **Qwen3-VL-235B-Instruct-FP8 (blue)** demonstrates significant fluctuations, particularly in "Verified Correct" (sharp rise at 0.8 threshold).
4. In "Random Guess Correct," skip rates for all models exceed 10%, suggesting potential issues with confidence calibration or data noise.
---
### Interpretation
- **Model Performance**: Qwen3.5-397B-A17B-FP8 appears less reliable, with high skip rates even for verified correct answers. This may indicate overconfidence or poor threshold calibration.
- **Step3-VL-10B** shows robustness, maintaining lower skip rates across thresholds, suggesting better generalization.
- **Qwen3-VL-235B-Instruct-FP8**'s erratic trends (e.g., sharp rise at 0.8 in "Verified Correct") hint at sensitivity to similarity thresholds, possibly due to architectural limitations.
- The "Random Guess Correct" subplot reveals that even random guessing incurs non-trivial skip rates, implying potential flaws in the evaluation framework or data distribution.
The data underscores the importance of model architecture and threshold selection in balancing accuracy and skip rates. Further analysis of confidence scores and training data could clarify these patterns.