## Chart/Diagram Type: Multi-Panel Performance Comparison
### Overview
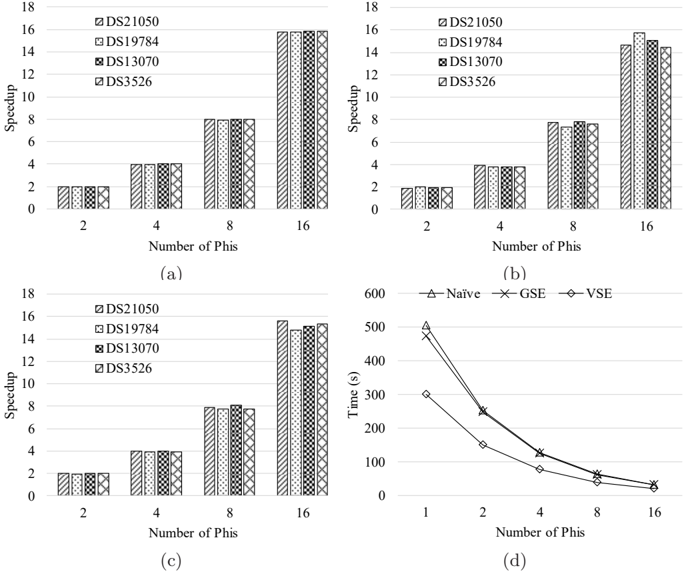
The image presents a multi-panel figure comparing the performance of different datasets (DS21050, DS19784, DS13070, DS3526) across varying numbers of Phis (2, 4, 8, 16). Panels (a), (b), and (c) display speedup as a function of the number of Phis using bar charts, while panel (d) shows execution time versus the number of Phis using line plots for different algorithms (Naive, GSE, VSE).
### Components/Axes
**Panels (a), (b), (c):**
* **Y-axis:** Speedup, ranging from 0 to 18.
* **X-axis:** Number of Phis, with discrete values of 2, 4, 8, and 16.
* **Legend (Top-Left):**
* DS21050 (horizontally dashed bars)
* DS19784 (white bars with dots)
* DS13070 (dark grey bars)
* DS3526 (bars with X pattern)
**Panel (d):**
* **Y-axis:** Time (s), ranging from 0 to 600.
* **X-axis:** Number of Phis, with values of 1, 2, 4, 8, and 16.
* **Legend (Top):**
* Naive (triangles)
* GSE (crosses)
* VSE (diamonds)
### Detailed Analysis
**Panels (a), (b), (c) - Speedup vs. Number of Phis:**
* **General Trend:** For all datasets in all three panels, speedup increases as the number of Phis increases.
* **Specific Values (Panel a):**
* At 2 Phis: Speedup is approximately 2 for all datasets.
* At 4 Phis: Speedup is approximately 4 for all datasets.
* At 8 Phis: Speedup is approximately 8 for all datasets.
* At 16 Phis: Speedup is approximately 16 for all datasets.
* **Specific Values (Panel b):**
* At 2 Phis: Speedup is approximately 2 for all datasets.
* At 4 Phis: Speedup is approximately 4 for all datasets.
* At 8 Phis: Speedup is approximately 8 for all datasets.
* At 16 Phis: Speedup is approximately 15 for all datasets.
* **Specific Values (Panel c):**
* At 2 Phis: Speedup is approximately 2 for all datasets.
* At 4 Phis: Speedup is approximately 4 for all datasets.
* At 8 Phis: Speedup is approximately 8 for all datasets.
* At 16 Phis: Speedup is approximately 16 for all datasets.
**Panel (d) - Time vs. Number of Phis:**
* **General Trend:** Execution time decreases as the number of Phis increases for all algorithms.
* **Naive:** Starts at approximately 500s with 1 Phi and decreases to approximately 30s with 16 Phis.
* **GSE:** Starts at approximately 480s with 1 Phi and decreases to approximately 30s with 16 Phis.
* **VSE:** Starts at approximately 300s with 1 Phi and decreases to approximately 25s with 16 Phis.
### Key Observations
* Panels (a), (b), and (c) show similar trends in speedup across different datasets as the number of Phis increases.
* Panel (d) demonstrates that increasing the number of Phis reduces execution time for all algorithms tested.
* VSE consistently outperforms Naive and GSE in terms of execution time.
### Interpretation
The data suggests that increasing the number of Phis leads to improved performance, both in terms of speedup and reduced execution time. The similarity in speedup across different datasets in panels (a), (b), and (c) indicates that the performance gain is relatively consistent regardless of the specific dataset used. Panel (d) highlights the effectiveness of the VSE algorithm compared to Naive and GSE, as it achieves significantly lower execution times, especially with a smaller number of Phis. The diminishing returns observed in panel (d) as the number of Phis increases suggest that there may be a point beyond which adding more Phis provides minimal performance improvement.