# Technical Document Extraction: Network Flow Analysis Chart
## 1. Component Isolation
* **Header/Legend Region:** Located at the top center of the plot area.
* **Main Chart Area:** A line graph with a logarithmic Y-axis and linear X-axis, featuring a grid.
* **Axis Region:** X-axis (bottom) and Y-axis (left) with labels and numerical scales.
## 2. Metadata and Axis Information
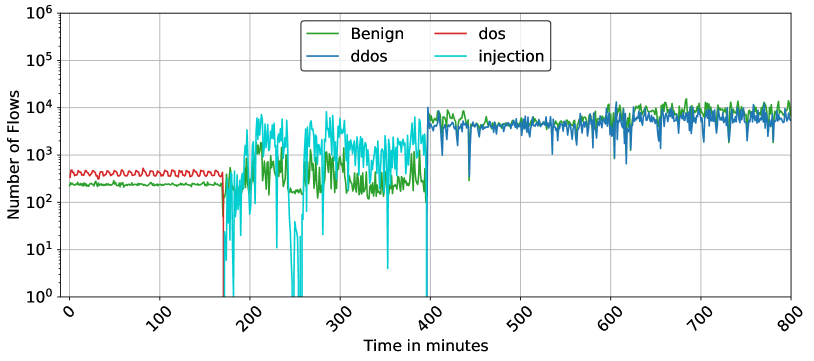
* **Y-Axis Label:** "Number of Flows"
* **Y-Axis Scale:** Logarithmic, ranging from $10^0$ (1) to $10^6$ (1,000,000). Major markers at $10^0, 10^1, 10^2, 10^3, 10^4, 10^5, 10^6$.
* **X-Axis Label:** "Time in minutes"
* **X-Axis Scale:** Linear, ranging from 0 to 800. Major markers every 100 units (0, 100, 200, 300, 400, 500, 600, 700, 800). Labels are rotated approximately 45 degrees.
* **Legend [Spatial Grounding: Top Center]:**
* **Green Line:** Benign
* **Red Line:** dos
* **Dark Blue Line:** ddos
* **Cyan Line:** injection
## 3. Data Series Analysis and Trend Verification
### Series 1: Benign (Green)
* **Trend:** Starts as a stable baseline, becomes highly volatile in the middle section, and stabilizes at a higher volume in the final section.
* **0 - ~170 mins:** Stable horizontal line at approximately $2 \times 10^2$ flows.
* **~170 - 400 mins:** Significant fluctuation/noise, oscillating between $10^2$ and $10^3$ flows.
* **400 - 800 mins:** Shifts upward to a higher baseline, fluctuating between $4 \times 10^3$ and $10^4$ flows.
### Series 2: dos (Red)
* **Trend:** Short-lived, high-frequency oscillation followed by a total drop-off.
* **0 - ~170 mins:** Oscillates rapidly in a tight band just above the benign traffic, approximately at $4 \times 10^2$ flows.
* **~170 mins:** Sharp vertical drop to $10^0$ (or zero), disappearing from the chart for the remainder of the duration.
### Series 3: injection (Cyan)
* **Trend:** Highly erratic and intermittent activity appearing only in the second quarter of the timeline.
* **0 - ~170 mins:** No data/Zero flows.
* **~170 - 400 mins:** Extremely volatile. Spikes from $10^0$ up to nearly $10^4$ flows. Frequent "drop-outs" to the baseline.
* **400 - 800 mins:** No data/Zero flows.
### Series 4: ddos (Dark Blue)
* **Trend:** Late-onset activity that mirrors the benign traffic pattern in the final half of the observation.
* **0 - 400 mins:** No data/Zero flows.
* **400 - 800 mins:** Appears abruptly at minute 400. Follows a similar trajectory to the "Benign" traffic but remains slightly lower in volume, fluctuating between $10^3$ and $8 \times 10^3$ flows.
## 4. Summary of Events
The chart depicts four distinct phases of network activity:
1. **Phase 1 (0-170m):** Steady state with "Benign" and "dos" traffic present.
2. **Phase 2 (170m):** "dos" traffic ceases abruptly.
3. **Phase 3 (170-400m):** "injection" attacks occur with high volatility; "Benign" traffic becomes more unstable.
4. **Phase 4 (400-800m):** "injection" stops; "ddos" traffic begins and persists alongside a significantly increased volume of "Benign" traffic.