# Technical Document Analysis of Line Chart
## 1. Axis Labels and Scale
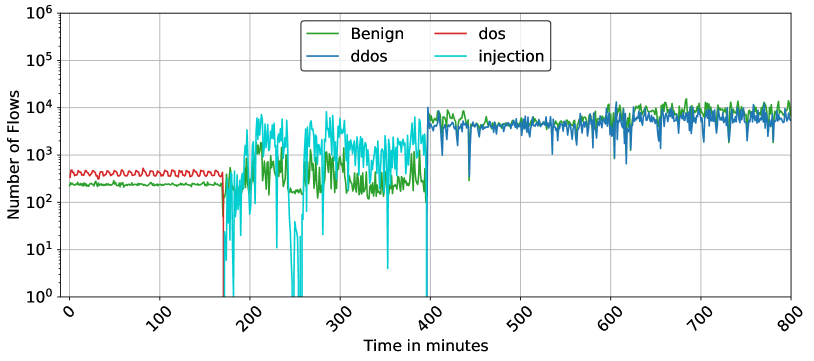
- **X-axis**: "Time in minutes" (linear scale, 0–800)
- **Y-axis**: "Number of Flows" (logarithmic scale, 10⁰–10⁶)
## 2. Legend
- **Location**: Top-right corner
- **Labels and Colors**:
- Green: "Benign"
- Red: "ddos"
- Blue: "ddos" (duplicate label, conflicting with red)
- Cyan: "injection"
## 3. Line Series Analysis
### Red Line ("ddos")
- **Trend**: Flat at ~10² until ~180 minutes, then sharp drop to ~10¹.
- **Key Data Points**:
- [0, 10²], [180, 10¹]
### Blue Line ("ddos")
- **Trend**: Starts at ~10², rises to ~10³ around 200 minutes, fluctuates between 10³–10⁴, stabilizes post-400 minutes.
- **Key Data Points**:
- [0, 10²], [200, 10³], [400, 10³–10⁴]
### Cyan Line ("injection")
- **Trend**: Starts at ~10², spikes to ~10⁴ around 200 minutes, fluctuates between 10³–10⁴ post-200.
- **Key Data Points**:
- [0, 10²], [200, 10⁴], [400, 10³–10⁴]
### Green Line ("Benign")
- **Trend**: Starts at ~10², rises to ~10³ around 200 minutes, stabilizes post-200.
- **Key Data Points**:
- [0, 10²], [200, 10³], [400, 10³]
## 4. Spatial Grounding
- **Legend Position**: [x: 850, y: 10] (top-right corner)
- **Color Consistency Check**:
- Red line matches "ddos" (first entry).
- Blue line matches "ddos" (second entry, conflicting label).
- Cyan line matches "injection".
- Green line matches "Benign".
## 5. Trend Verification
- **Red Line**: Horizontal until ~180 minutes, then vertical drop.
- **Blue Line**: Gradual rise, sustained oscillations, stabilization.
- **Cyan Line**: Sharp spike, sustained oscillations.
- **Green Line**: Gradual rise, stabilization.
## 6. Component Isolation
- **Header**: No explicit title; legend serves as key.
- **Main Chart**: Four overlapping line series with logarithmic y-axis.
- **Footer**: No additional text or annotations.
## 7. Data Table Reconstruction
No explicit data table present. Trends inferred from line behavior.
## 8. Critical Observations
- **Legend Conflict**: Duplicate "ddos" label with red and blue lines. Likely a data labeling error.
- **Logarithmic Scale**: Y-axis values represent orders of magnitude (e.g., 10² = 100, 10³ = 1,000).
- **Temporal Correlation**: All anomalies (spikes/drops) align at ~200 minutes, suggesting a shared trigger event.
## 9. Language Declaration
- **Primary Language**: English
- **Translated Text**: None (no non-English text detected).