## Chart: Proportion of Flips vs. Iterations for SmolLM2-1.7B
### Overview
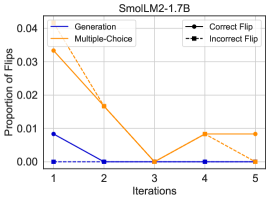
The image is a line chart comparing the proportion of flips (presumably in a model's output) across iterations for different methods: Generation and Multiple-Choice. It also distinguishes between correct and incorrect flips. The chart shows how the proportion of flips changes over five iterations for each method.
### Components/Axes
* **Title:** SmolLM2-1.7B
* **X-axis:** Iterations (labeled 1 to 5)
* **Y-axis:** Proportion of Flips (ranging from 0.00 to 0.04)
* **Legend:** Located at the top-left and top-right of the chart.
* **Generation:** Solid dark blue line
* **Multiple-Choice:** Solid orange line
* **Correct Flip:** Solid black line with circle markers
* **Incorrect Flip:** Dashed black line with square markers
### Detailed Analysis
* **Generation:**
* The proportion of flips starts at approximately 0.008 at iteration 1 and drops to approximately 0.00 at iteration 2, remaining at 0.00 for iterations 3, 4, and 5.
* The trend is a sharp decrease from iteration 1 to 2, then a flat line.
* **Multiple-Choice:**
* The proportion of flips starts at approximately 0.034 at iteration 1, decreases to approximately 0.016 at iteration 2, and then drops to approximately 0.00 at iteration 3. It then increases to approximately 0.008 at iteration 4, and remains at approximately 0.008 at iteration 5.
* The trend is a decrease from iteration 1 to 3, followed by a slight increase at iteration 4, and then a flat line.
* **Correct Flip:**
* The proportion of flips is approximately 0.00 for all iterations.
* The trend is a flat line at 0.00.
* **Incorrect Flip:**
* The proportion of flips is approximately 0.00 for all iterations.
* The trend is a flat line at 0.00.
### Key Observations
* The Generation method has a higher initial proportion of flips compared to the Multiple-Choice method, but it quickly drops to zero and remains there.
* The Multiple-Choice method starts with a higher proportion of flips, decreases, and then plateaus at a low value.
* Both Correct Flip and Incorrect Flip remain at a proportion of 0.00 across all iterations.
### Interpretation
The data suggests that the Generation method is initially more prone to flips but quickly stabilizes, while the Multiple-Choice method exhibits a more gradual decrease in the proportion of flips. The fact that both Correct Flip and Incorrect Flip remain at zero indicates that the model is not making any flips that are either correct or incorrect, suggesting a high level of confidence in its predictions or a lack of exploration. The difference in the initial proportion of flips between Generation and Multiple-Choice could be due to the different approaches used by these methods. The stabilization of the Generation method could indicate that it quickly learns to avoid flips, while the Multiple-Choice method may require more iterations to reach a similar level of stability.