\n
## Line Chart: SmolLM2-1.7B - Proportion of Flips Over Iterations
### Overview
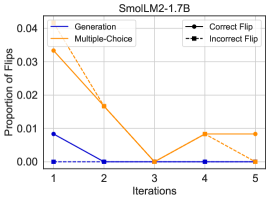
This is a line chart titled "SmolLM2-1.7B" that plots the "Proportion of Flips" against the number of "Iterations" (from 1 to 5). It compares four different data series, distinguished by color and line style, as defined in a legend located in the top-left corner of the chart area. The chart appears to track a performance or behavioral metric of a model named SmolLM2-1.7B across sequential iterations.
### Components/Axes
* **Title:** "SmolLM2-1.7B" (centered at the top).
* **Y-Axis:**
* **Label:** "Proportion of Flips" (rotated vertically on the left).
* **Scale:** Linear scale from 0.00 to 0.04, with major tick marks at 0.00, 0.01, 0.02, 0.03, and 0.04.
* **X-Axis:**
* **Label:** "Iterations" (centered at the bottom).
* **Scale:** Discrete integer scale from 1 to 5, with major tick marks at each integer.
* **Legend:** Positioned in the top-left quadrant of the chart area. It contains four entries:
1. **Generation:** Solid blue line.
2. **Multiple-Choice:** Solid orange line.
3. **Correct Flip:** Dashed orange line.
4. **Incorrect Flip:** Dashed black line.
### Detailed Analysis
The chart displays the following approximate data points for each series across the five iterations:
**1. Generation (Solid Blue Line):**
* **Trend:** Starts low, drops to zero, and remains flat.
* **Data Points:**
* Iteration 1: ~0.008
* Iteration 2: 0.00
* Iteration 3: 0.00
* Iteration 4: 0.00
* Iteration 5: 0.00
**2. Multiple-Choice (Solid Orange Line):**
* **Trend:** Starts high, decreases sharply to zero, then shows a partial recovery before plateauing.
* **Data Points:**
* Iteration 1: ~0.033
* Iteration 2: ~0.017
* Iteration 3: 0.00
* Iteration 4: ~0.008
* Iteration 5: ~0.008
**3. Correct Flip (Dashed Orange Line):**
* **Trend:** Follows a similar initial downward trend to the "Multiple-Choice" line but diverges after iteration 3, ending at zero.
* **Data Points:**
* Iteration 1: ~0.033 (appears to start at the same point as Multiple-Choice)
* Iteration 2: ~0.017 (appears to track with Multiple-Choice)
* Iteration 3: 0.00
* Iteration 4: ~0.008 (appears to track with Multiple-Choice)
* Iteration 5: 0.00
**4. Incorrect Flip (Dashed Black Line):**
* **Trend:** Remains constant at zero throughout all iterations.
* **Data Points:**
* Iterations 1-5: 0.00
### Key Observations
1. **Dominant Initial Value:** The "Multiple-Choice" and "Correct Flip" series start with the highest proportion of flips (~0.033) at iteration 1.
2. **Convergence to Zero:** Both the "Generation" and "Multiple-Choice"/"Correct Flip" series experience a significant drop, reaching 0.00 by iteration 2 and 3, respectively.
3. **Partial Recovery:** The "Multiple-Choice" series shows a distinct recovery from 0.00 at iteration 3 to ~0.008 at iteration 4, where it stabilizes. The "Correct Flip" series does not share this recovery at iteration 5.
4. **Zero Baseline:** The "Incorrect Flip" series shows no activity (0.00) across all measured iterations.
5. **Line Style Correlation:** The solid and dashed orange lines ("Multiple-Choice" and "Correct Flip") are perfectly correlated for the first four data points (iterations 1-4) but diverge at the final point (iteration 5).
### Interpretation
The chart suggests a process where the model's behavior, measured by the "Proportion of Flips," changes significantly over the first few iterations. The high initial values for "Multiple-Choice" and "Correct Flip" indicate a period of volatility or adjustment. The subsequent drop to zero implies a stabilization phase.
The key insight lies in the divergence at iteration 5: while the overall "Multiple-Choice" proportion remains elevated, the "Correct Flip" proportion drops back to zero. This could indicate that the flips occurring in later iterations (4 and 5) are no longer classified as "Correct Flips" according to the chart's definition, or that a different mechanism is sustaining the "Multiple-Choice" flip rate. The flat "Incorrect Flip" line suggests that the observed flips are not categorized as incorrect within this framework. The "Generation" series stabilizes almost immediately, implying that this particular task or metric reaches a steady state very quickly compared to the "Multiple-Choice" task.