## Diagram: Flow Diagram of Interconnected Nodes
### Overview
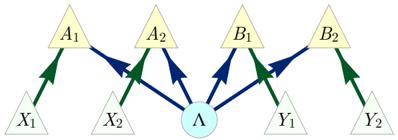
This image depicts a directed graph, illustrating relationships and flows between several labeled nodes. The nodes are represented by triangles and a circle, with arrows indicating the direction of influence or connection. The diagram appears to represent a system with inputs, intermediate processing, and outputs, or a hierarchical structure.
### Components/Axes
There are no explicit axes or legends in this diagram. The components are:
* **Central Node:** A light blue circle labeled "Λ" (Lambda). This node is positioned centrally at the bottom of the diagram.
* **Upper Tier Triangles:** Four triangles, colored light yellow, labeled "A₁", "A₂", "B₁", and "B₂". These are positioned above and to the left and right of the central node.
* **Lower Tier Triangles:** Four triangles, colored light grey/green, labeled "X₁", "X₂", "Y₁", and "Y₂". These are positioned below and to the left and right of the upper tier triangles, and further out from the center.
* **Arrows:**
* **Dark Blue Arrows:** These arrows originate from the central node "Λ" and point towards the upper tier triangles "A₁", "A₂", "B₁", and "B₂". There is also a dark blue arrow originating from "A₁" and pointing towards "A₂", and another originating from "B₂" and pointing towards "B₁".
* **Dark Green Arrows:** These arrows originate from the lower tier triangles "X₁", "X₂", "Y₁", and "Y₂" and point towards the upper tier triangles "A₁", "A₂", "B₁", and "B₂" respectively. Specifically:
* "X₁" points to "A₁".
* "X₂" points to "A₂".
* "Y₁" points to "B₁".
* "Y₂" points to "B₂".
### Detailed Analysis or Content Details
The diagram shows the following connections:
1. **From Lower Tier to Upper Tier (Green Arrows):**
* X₁ → A₁
* X₂ → A₂
* Y₁ → B₁
* Y₂ → B₂
2. **From Central Node to Upper Tier (Blue Arrows):**
* Λ → A₁
* Λ → A₂
* Λ → B₁
* Λ → B₂
3. **Between Upper Tier Nodes (Blue Arrows):**
* A₁ → A₂
* B₂ → B₁
### Key Observations
* The central node "Λ" appears to be a primary source or controller, influencing all nodes in the upper tier.
* The lower tier nodes (X₁, X₂, Y₁, Y₂) act as direct inputs to their corresponding upper tier nodes.
* There are interdependencies within the upper tier, with "A₁" influencing "A₂" and "B₂" influencing "B₁". This suggests a sequential or feedback mechanism within these groups.
* The arrangement suggests two distinct processing pathways or groups: one involving A₁, A₂ and another involving B₁, B₂.
### Interpretation
This diagram likely represents a system where a central entity "Λ" provides a foundational input or control signal to two pairs of processing units (A₁, A₂) and (B₁, B₂). Additionally, external inputs (X₁, X₂, Y₁, Y₂) are fed directly into these processing units. The arrows between A₁ and A₂, and B₂ and B₁ indicate that the output or state of one unit in a pair influences the other, suggesting a form of sequential processing, feedback loop, or dependency within each pair. The overall structure could represent a computational model, a biological pathway, a decision-making process, or a network architecture where "Λ" is a global parameter or initial state, "X" and "Y" are specific inputs, and "A" and "B" represent intermediate or final processing stages. The directionality of the arrows is crucial, defining the flow of information or influence. The specific labels (A, B, X, Y, Λ) suggest a symbolic representation, possibly from a scientific or mathematical context.