\n
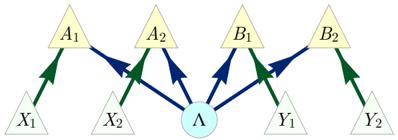
## Diagram: Probabilistic Graphical Model
### Overview
The image depicts a probabilistic graphical model, specifically a directed acyclic graph (DAG). It illustrates relationships between variables represented as nodes, with directed edges indicating probabilistic dependencies. The diagram shows a central node 'A' connected to four other nodes (A1, A2, B1, B2) and these nodes are in turn connected to nodes X1, X2, Y1, and Y2 respectively.
### Components/Axes
The diagram consists of the following components:
* **Nodes:** Represented by triangles (X1, X2, Y1, Y2, A1, A2, B1, B2) and a circle (A).
* **Edges:** Represented by arrows, indicating the direction of probabilistic influence.
* **Node Labels:** X1, X2, Y1, Y2, A1, A2, B1, B2, A.
* **Colors:** Nodes are yellow, except for node 'A' which is light blue. Arrows are dark blue for connections to 'A' and green for connections from A1, A2, B1, and B2.
### Detailed Analysis or Content Details
The diagram shows the following relationships:
* X1 is connected to A1 with a green arrow.
* X2 is connected to A2 with a green arrow.
* Y1 is connected to B1 with a green arrow.
* Y2 is connected to B2 with a green arrow.
* A1 is connected to A with a dark blue arrow.
* A2 is connected to A with a dark blue arrow.
* B1 is connected to A with a dark blue arrow.
* B2 is connected to A with a dark blue arrow.
There are no numerical values or scales present in the diagram. It is a purely structural representation of dependencies.
### Key Observations
The central node 'A' appears to be a common cause or parent node for A1, A2, B1, and B2. The nodes X1, X2, Y1, and Y2 are influenced by their respective parent nodes (A1, A2, B1, B2). The diagram is acyclic, meaning there are no loops in the directed edges.
### Interpretation
This diagram likely represents a Bayesian network or a similar probabilistic model. The structure suggests that the variables X1, X2, Y1, and Y2 are conditionally independent given their respective parent nodes (A1, A2, B1, B2). The node 'A' could represent a latent variable or a common cause influencing the other variables. The arrows indicate the direction of probabilistic dependence – for example, knowing the value of A1 provides information about the likely value of X1. The model could be used for inference, prediction, or causal reasoning. The use of different arrow colors (green and blue) might indicate different types of relationships or different stages in a modeling process, but without further context, this is speculative. The diagram is a visual representation of a set of conditional independence assumptions.