## Diagram: Directed Graph with Labeled Nodes and Colored Edges
### Overview
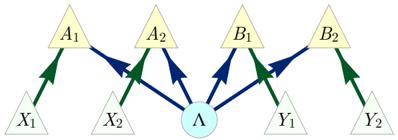
The image displays a directed graph diagram consisting of nine nodes arranged in two horizontal rows, connected by colored arrows. The nodes are geometric shapes (triangles and a circle) with alphanumeric labels. The arrows are of two distinct colors (green and dark blue), indicating different types of relationships or flows between the nodes. The diagram appears to represent a structured model, possibly from fields like statistics, machine learning, or systems theory, showing dependencies between variables.
### Components/Axes
**Nodes (Top Row - Yellow Triangles):**
* **A₁** (Top-left)
* **A₂** (Top-center-left)
* **B₁** (Top-center-right)
* **B₂** (Top-right)
**Nodes (Bottom Row - White Triangles):**
* **X₁** (Bottom-left)
* **X₂** (Bottom-center-left)
* **Y₁** (Bottom-center-right)
* **Y₂** (Bottom-right)
**Central Node (Light Blue Circle):**
* **Λ** (Lambda) - Positioned centrally between the two rows.
**Edges (Arrows):**
* **Green Arrows:** Indicate a direct, likely primary relationship.
* **Dark Blue Arrows:** Indicate a different, possibly secondary or influential relationship.
### Detailed Analysis
**Spatial Layout and Connections:**
The diagram is organized with a clear top-down and center-out flow.
1. **Green Arrow Connections (Bottom to Top):**
* From **X₁** to **A₁**.
* From **X₂** to **A₂**.
* From **Y₁** to **B₁**.
* From **Y₂** to **B₂**.
* *Trend/Pattern:* Each bottom-row "X" or "Y" node has a single green arrow pointing directly to its corresponding top-row "A" or "B" node (X→A, Y→B).
2. **Dark Blue Arrow Connections (From Central Λ):**
* From **Λ** to **A₁**.
* From **Λ** to **A₂**.
* From **Λ** to **B₁**.
* From **Λ** to **B₂**.
* From **Λ** to **X₂**.
* From **Λ** to **Y₁**.
* *Trend/Pattern:* The central node **Λ** has outgoing dark blue arrows to all four top-row nodes (A₁, A₂, B₁, B₂) and to two of the bottom-row nodes (X₂, Y₁). It does **not** connect to X₁ or Y₂.
**Component Isolation:**
* **Header/Top Region:** Contains the four yellow outcome or dependent variable nodes (A₁, A₂, B₁, B₂).
* **Main/Center Region:** Dominated by the central **Λ** node, which acts as a hub.
* **Footer/Bottom Region:** Contains the four white input or independent variable nodes (X₁, X₂, Y₁, Y₂).
### Key Observations
1. **Asymmetric Influence of Λ:** The central node **Λ** influences all top-tier nodes but only a subset of the bottom-tier nodes (X₂ and Y₁). X₁ and Y₂ are not directly influenced by Λ.
2. **Dual Parentage:** Nodes **A₂** and **B₁** have two incoming edges: a green arrow from their corresponding bottom node (X₂, Y₁) and a dark blue arrow from Λ. This suggests they are influenced by both a direct source and the central factor.
3. **Single Parentage:** Nodes **A₁**, **B₂**, **X₁**, **X₂**, **Y₁**, and **Y₂** have only one incoming edge each. For A₁ and B₂, it's from their corresponding bottom node. For X₂ and Y₁, it's from Λ.
4. **Color-Coded Semantics:** The consistent use of green for X→A/Y→B links and dark blue for Λ→ links strongly implies two distinct types of relationships are being modeled (e.g., direct measurement vs. latent influence, treatment vs. confounding factor).
### Interpretation
This diagram likely represents a **graphical model**, such as a Bayesian network or structural equation model. The labels suggest the following plausible interpretation:
* **X₁, X₂, Y₁, Y₂:** Observed input variables or measurements.
* **A₁, A₂, B₁, B₂:** Observed output variables, outcomes, or different manifestations.
* **Λ (Lambda):** A **latent variable** or common cause that is not directly observed but influences multiple other variables in the system.
**What the data suggests:**
The structure proposes that the outcomes (A's and B's) are generated from two sources: 1) their specific paired input (X or Y via green arrows), and 2) a common underlying factor Λ (via dark blue arrows). Furthermore, Λ also directly affects some of the inputs themselves (X₂ and Y₁), indicating a complex system where the latent factor can influence both the inputs and the outputs. The isolation of X₁ and Y₂ from Λ suggests they might be exogenous variables or control factors in this model.
**Notable Anomalies/Patterns:**
The asymmetry is the most notable feature. Why does Λ influence X₂ and Y₁ but not X₁ and Y₂? This could be a key hypothesis of the model being illustrated—for example, that the latent factor only affects a specific subset of the measured inputs. The diagram effectively visualizes a theory about conditional dependencies and the flow of influence within a system, distinguishing between direct pathways (green) and pathways mediated by a common cause (dark blue).