\n
## Diagram: Reasoning Process Comparison - MCTS vs. Auto-label
### Overview
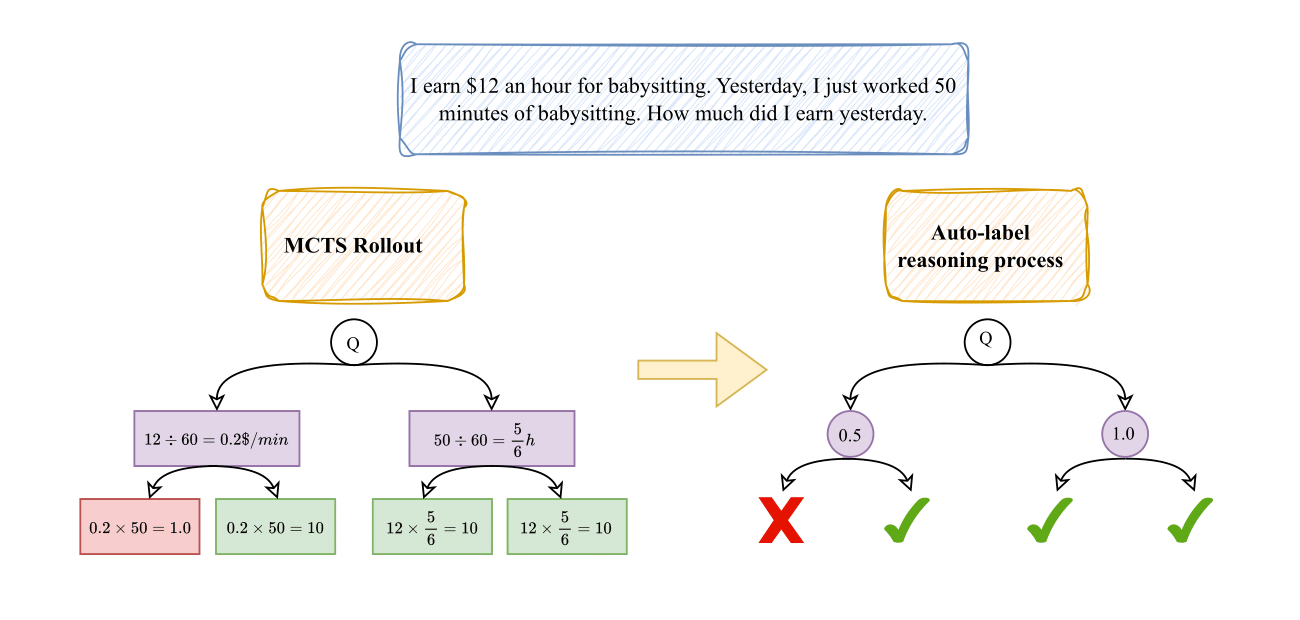
This diagram illustrates a comparison between two reasoning processes: MCTS Rollout and Auto-label reasoning. Both processes are presented as attempting to solve the word problem: "I earn $12 an hour for babysitting. Yesterday, I just worked 50 minutes of babysitting. How much did I earn yesterday." The diagram visually depicts the steps each process takes, highlighting the intermediate calculations and final outcomes, with indicators of correctness.
### Components/Axes
The diagram consists of two main sections, one for each reasoning process. Each section includes:
* **Process Title:** "MCTS Rollout" and "Auto-label reasoning process" in yellow rounded rectangles at the top.
* **Query Node (Q):** A circular node labeled "Q" representing the initial question.
* **Intermediate Calculation Steps:** Rectangular nodes showing the mathematical calculations.
* **Final Result Nodes:** Circular nodes representing the final answer.
* **Correctness Indicators:** Red "X" and green checkmarks indicating whether the final result is correct.
* **Arrows:** Representing the flow of reasoning.
* **Text:** The initial word problem is stated at the top of the diagram.
### Detailed Analysis or Content Details
**MCTS Rollout Section (Left Side):**
1. **Initial Question (Q):** The process starts with the question "Q".
2. **Step 1:** `12 ÷ 60 = 0.2$/min`
3. **Step 2:** `0.2 × 50 = 1.0`
4. **Step 3:** `12 ÷ 60 = 0.2$/min`
5. **Step 4:** `12 × 50/60 = 10`
6. **Final Result:** A circular node with the value "1.0" (purple) and a circular node with the value "10" (purple).
**Auto-label Reasoning Process Section (Right Side):**
1. **Initial Question (Q):** The process starts with the question "Q".
2. **Step 1:** `50 ÷ 60 = 5/6 h`
3. **Step 2:** `12 × 5/6 = 10`
4. **Step 3:** `50 ÷ 60 = 5/6 h`
5. **Step 4:** `12 × 5/6 = 10`
6. **Final Result:** A circular node with the value "0.5" (purple) with a red "X" indicating an incorrect answer, and three circular nodes with the value "1.0" (purple) with green checkmarks indicating correct answers.
### Key Observations
* The MCTS Rollout section shows multiple calculation paths, leading to two different final results: 1.0 and 10.
* The Auto-label reasoning process section shows a more direct path, but initially produces an incorrect result (0.5) before arriving at the correct answer (10) multiple times.
* The correctness indicators (X and checkmarks) clearly show which results are considered correct.
* The MCTS Rollout section appears to explore multiple possibilities, while the Auto-label process seems to refine its answer.
### Interpretation
The diagram demonstrates a comparison of two different approaches to solving a simple arithmetic word problem. MCTS Rollout explores multiple paths, potentially representing different interpretations or calculation strategies. The Auto-label reasoning process appears to be more focused, but initially makes a mistake before converging on the correct answer. The presence of multiple correct answers in the MCTS Rollout section (1.0 and 10) suggests that the problem might have multiple valid interpretations or that the MCTS process is not always accurate. The Auto-label process, while initially flawed, ultimately arrives at the correct answer, indicating its ability to self-correct. The diagram highlights the trade-offs between exploration (MCTS) and efficiency (Auto-label) in reasoning processes. The diagram suggests that the correct answer is $10, as indicated by the green checkmarks in the Auto-label section and one of the final results in the MCTS section.