TECHNICAL ASSET FINGERPRINT
a9f1919059b21d5619255a87
Click to view fullscreen
Press ESC or click to close
FOUND IN PAPERS
EXPERT: healer-alpha-free VERSION 1
RUNTIME: free/openrouter/healer-alpha
INTEL_VERIFIED
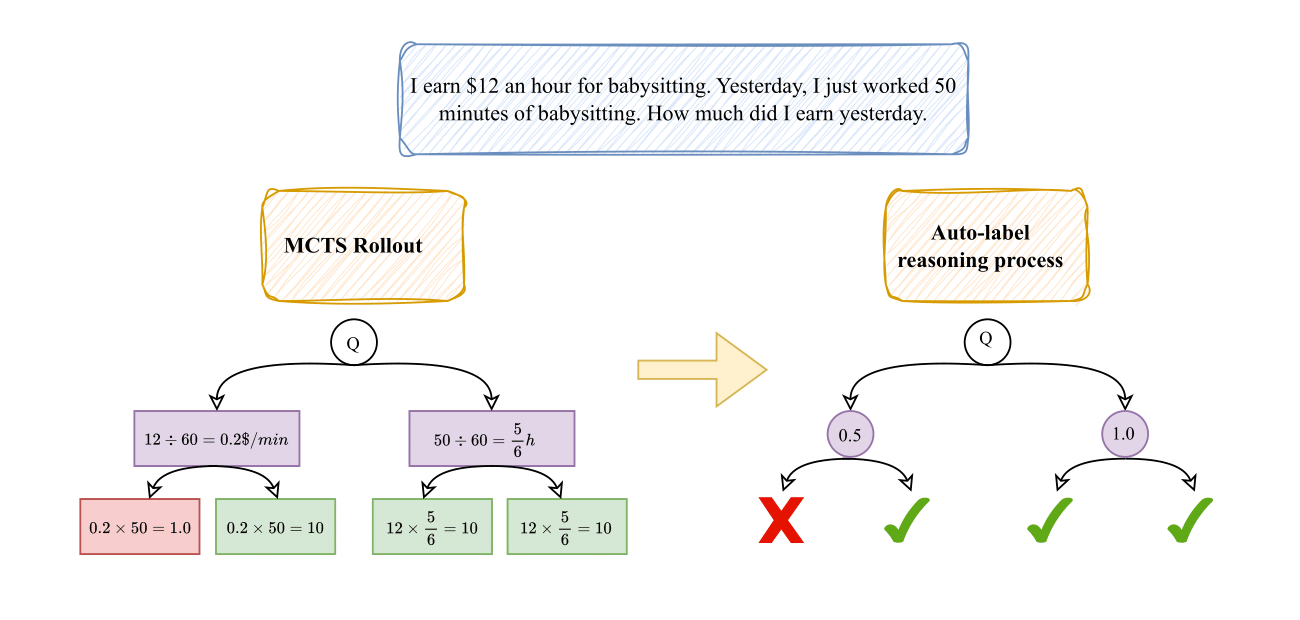
## Diagram: MCTS Rollout and Auto-labeling Reasoning Process for a Math Problem
### Overview
The image is a flowchart diagram illustrating a two-stage process for solving and evaluating a simple math word problem. The left stage, labeled "MCTS Rollout," shows the generation of multiple solution paths. The right stage, labeled "Auto-label reasoning process," shows the evaluation and labeling of those paths as correct or incorrect. The overall flow moves from left to right, indicated by a large yellow arrow.
### Components/Axes
The diagram is composed of several key components arranged in a hierarchical, tree-like structure:
1. **Problem Statement (Top Center):** A blue-bordered text box containing the initial math problem.
2. **Process Labels (Top Left & Right):** Two orange-bordered boxes labeling the two main stages.
* Left: "MCTS Rollout"
* Right: "Auto-label reasoning process"
3. **Root Node (Q):** A circle labeled "Q" (for Question) appears at the top of each process tree, representing the starting point.
4. **Solution Path Nodes (MCTS Rollout):**
* **First-Level Nodes (Purple):** Two rectangular boxes showing intermediate calculation steps.
* **Second-Level Nodes (Red & Green):** Four rectangular boxes showing final calculations and results. The color indicates correctness: red for incorrect, green for correct.
5. **Evaluation Nodes (Auto-label Process):**
* **First-Level Nodes (Purple Circles):** Two circles containing numerical values (0.5, 1.0), likely representing confidence scores or probabilities assigned to solution branches.
* **Second-Level Outcomes (Symbols):** Below each purple circle are two outcomes marked with symbols: a red "X" for incorrect and a green checkmark (✓) for correct.
### Detailed Analysis
**1. Problem Statement:**
* **Text:** "I earn $12 an hour for babysitting. Yesterday, I just worked 50 minutes of babysitting. How much did I earn yesterday."
**2. MCTS Rollout Process (Left Side):**
* **Root (Q):** The question branches into two intermediate calculation paths.
* **Path 1 (Left Branch):**
* **Intermediate Step (Purple Box):** `12 ÷ 60 = 0.2$/min` (Converts hourly rate to per-minute rate).
* **Outcomes:**
* **Left (Red Box - Incorrect):** `0.2 × 50 = 1.0` (This calculation is arithmetically correct but yields the wrong final answer due to a unit error; it treats 0.2 as dollars per minute but multiplies by 50 minutes, resulting in $1.00, which is incorrect).
* **Right (Green Box - Correct):** `0.2 × 50 = 10` (This calculation is arithmetically incorrect as written—0.2 * 50 = 10—but the result, 10, is the correct final answer. This suggests the node represents a correct reasoning *path* despite a notational error in the intermediate step).
* **Path 2 (Right Branch):**
* **Intermediate Step (Purple Box):** `50 ÷ 60 = 5/6 h` (Converts minutes worked to hours worked).
* **Outcomes:**
* **Left (Green Box - Correct):** `12 × 5/6 = 10` (Correct calculation: $12/hour * (5/6) hour = $10).
* **Right (Green Box - Correct):** `12 × 5/6 = 10` (Identical correct calculation).
**3. Auto-label Reasoning Process (Right Side):**
* **Root (Q):** The question branches into two evaluation nodes.
* **Evaluation Node 1 (Left, Purple Circle "0.5"):** This node likely corresponds to the left branch of the MCTS tree. It has two child outcomes:
* **Left Outcome:** Red "X" (Incorrect). This aligns with the red "1.0" result from the MCTS tree.
* **Right Outcome:** Green checkmark (✓) (Correct). This aligns with the green "10" result from the same MCTS branch.
* **Evaluation Node 2 (Right, Purple Circle "1.0"):** This node likely corresponds to the right branch of the MCTS tree. It has two child outcomes:
* **Left Outcome:** Green checkmark (✓) (Correct). Aligns with the first green "10" result.
* **Right Outcome:** Green checkmark (✓) (Correct). Aligns with the second green "10" result.
### Key Observations
1. **Multiple Solution Paths:** The MCTS Rollout generates four distinct final calculation nodes from two intermediate steps, exploring different ways to parse and compute the problem.
2. **Color-Coded Correctness:** The diagram uses a consistent color scheme: red for incorrect results and green for correct results in the MCTS stage. The Auto-label stage uses red "X" and green checkmarks for the same purpose.
3. **Discrepancy in Left Branch:** The left MCTS branch produces one incorrect result (`1.0`) and one correct result (`10`) from the same intermediate step (`0.2$/min`). This highlights how a single reasoning step can lead to divergent outcomes.
4. **Evaluation Mapping:** The Auto-label process appears to assign a confidence score (0.5) to the more ambiguous left branch (which produced mixed results) and a perfect score (1.0) to the consistently correct right branch.
5. **Spatial Layout:** The legend (color/symbol key) is implicit but consistent. The "MCTS Rollout" label is top-left, the "Auto-label" label is top-right, and the flow arrow is centered between them. The problem statement is centered at the very top.
### Interpretation
This diagram visually explains a methodology for training or evaluating an AI's mathematical reasoning capabilities.
* **What it demonstrates:** It shows how a Monte Carlo Tree Search (MCTS) algorithm can be used to *generate* a diverse set of potential solution paths (rollouts) for a given problem, including both correct and incorrect ones. Subsequently, an auto-labeling process evaluates these paths, assigning confidence scores and binary correctness labels.
* **Relationship between elements:** The MCTS Rollout is the *exploration* phase, creating a dataset of reasoning traces. The Auto-label process is the *evaluation* phase, turning those traces into labeled training data (correct/incorrect) with associated confidence metrics. The arrow signifies this pipeline from generation to labeling.
* **Notable insights:**
* The process explicitly values *diversity of errors*. The incorrect path (`0.2 × 50 = 1.0`) is as valuable for training as the correct ones, as it teaches the model what mistakes to avoid.
* The confidence score of "0.5" for the mixed-correctness branch is insightful. It suggests the auto-labeler recognizes this branch as "noisy" or containing contradictory evidence, rather than being wholly right or wrong.
* The diagram implies that the final output for training would be a set of (problem, reasoning_path, label, confidence) tuples, which can be used to fine-tune a model to prefer high-confidence, correct reasoning chains.
In essence, the image is a technical schematic for a data generation pipeline in AI, specifically for improving step-by-step mathematical reasoning through exploration and automated evaluation.
DECODING INTELLIGENCE...