\n
## Scatter Plot: NSGA-II Performance on OneMinMax
### Overview
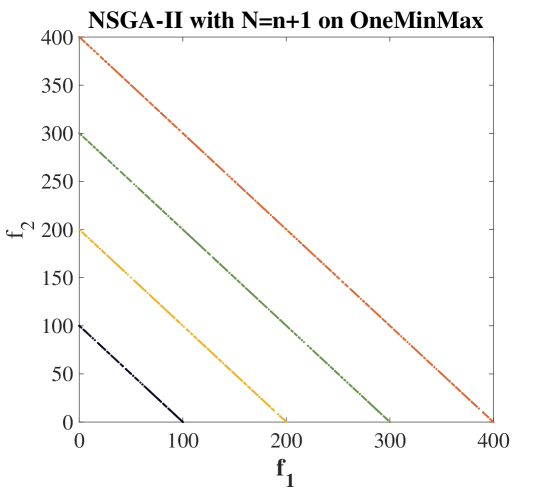
The image presents a scatter plot visualizing the performance of the NSGA-II algorithm with N=n+1 on the OneMinMax problem. The plot displays the distribution of solutions in the objective space, with f1 on the x-axis and f2 on the y-axis. There are five distinct lines representing different runs or iterations of the algorithm.
### Components/Axes
* **Title:** "NSGA-II with N=n+1 on OneMinMax" (Top-center)
* **X-axis Label:** "f1" (Bottom-center)
* **Y-axis Label:** "f2" (Left-center)
* **X-axis Scale:** 0 to 400, with tick marks at intervals of 100.
* **Y-axis Scale:** 0 to 400, with tick marks at intervals of 50.
* **Data Series:** Five lines, each with a distinct color:
* Dark Red
* Green
* Dark Orange
* Yellow
* Dark Blue
### Detailed Analysis
The plot shows five lines, each representing a Pareto front approximation generated by NSGA-II. Each line represents a set of non-dominated solutions.
* **Dark Red Line:** This line slopes downward from approximately (0, 380) to (400, 0). It appears to be the most dispersed line, covering a wide range of f1 and f2 values.
* **Green Line:** This line slopes downward from approximately (0, 260) to (400, 0). It is more concentrated than the dark red line.
* **Dark Orange Line:** This line slopes downward from approximately (0, 100) to (400, 0). It is relatively concentrated.
* **Yellow Line:** This line slopes downward from approximately (0, 150) to (400, 0). It is also relatively concentrated.
* **Dark Blue Line:** This line slopes downward from approximately (0, 50) to (400, 0). It is the most concentrated line, with solutions clustered near the origin.
All lines exhibit a generally negative correlation between f1 and f2, indicating a trade-off between the two objectives.
### Key Observations
* The lines represent different Pareto front approximations, with varying degrees of spread and convergence.
* The dark red line demonstrates the widest spread, suggesting a greater exploration of the objective space.
* The dark blue line shows the highest convergence, with solutions clustered near the origin.
* The lines are all approximately linear, suggesting a relatively simple trade-off between the two objectives.
### Interpretation
The plot illustrates the performance of the NSGA-II algorithm on the OneMinMax problem. The different lines represent the Pareto fronts obtained in different runs or iterations of the algorithm. The spread of the Pareto front indicates the diversity of solutions, while the convergence indicates how well the algorithm has optimized the objectives.
The wide spread of the dark red line suggests that NSGA-II is capable of exploring a wide range of solutions, but it may not have converged as well as other runs. The concentrated nature of the dark blue line suggests that NSGA-II has converged to a good solution, but it may have sacrificed diversity.
The overall trend suggests that NSGA-II is effective at finding a set of non-dominated solutions for the OneMinMax problem. The choice of which Pareto front to use depends on the specific application and the desired trade-off between diversity and convergence. The fact that all lines are roughly linear suggests that the problem is relatively well-behaved and that NSGA-II is able to find a good set of solutions without getting stuck in local optima.