## Line Chart: NSGA-II with N=n+1 on OneMinMax
### Overview
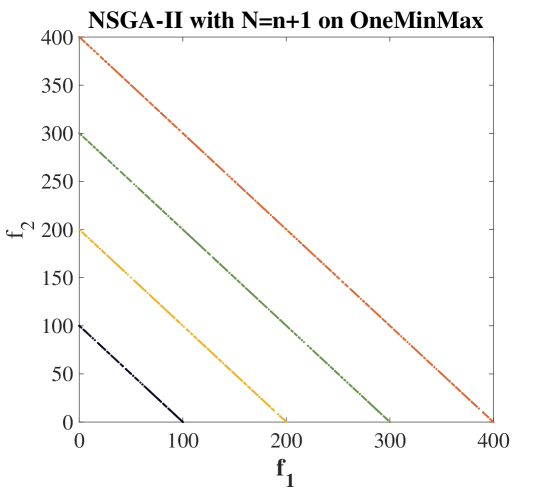
The chart visualizes the Pareto front generated by the NSGA-II (Non-dominated Sorting Genetic Algorithm II) algorithm applied to the OneMinMax multi-objective optimization problem. Four linear trade-off curves are plotted, representing different solutions in the objective space defined by two conflicting objectives, *f₁* and *f₂*. The axes range from 0 to 400, with *f₁* on the x-axis and *f₂* on the y-axis.
### Components/Axes
- **X-axis (f₁)**: Labeled "f₁", scaled from 0 to 400 in increments of 100.
- **Y-axis (f₂)**: Labeled "f₂", scaled from 0 to 400 in increments of 50.
- **Legend**: Located on the right side of the chart, associating four colors with distinct lines:
- **Red**: Topmost line (highest *f₂* values).
- **Green**: Second line (intermediate *f₂* values).
- **Yellow**: Third line (lower *f₂* values).
- **Blue**: Bottommost line (lowest *f₂* values).
- **Lines**: Four straight, diagonal lines spanning the plot, each representing a Pareto-optimal solution.
### Detailed Analysis
1. **Line Trends**:
- All lines exhibit a consistent negative slope, indicating an inverse relationship between *f₁* and *f₂* (as one objective improves, the other worsens).
- **Red Line**: Starts at (0, 400) and ends at (400, 0). Equation: *f₂ = -f₁ + 400*.
- **Green Line**: Starts at (0, 300) and ends at (300, 0). Equation: *f₂ = -f₁ + 300*.
- **Yellow Line**: Starts at (0, 200) and ends at (200, 0). Equation: *f₂ = -f₁ + 200*.
- **Blue Line**: Starts at (0, 100) and ends at (100, 0). Equation: *f₂ = -f₁ + 100*.
2. **Spatial Grounding**:
- The legend is positioned on the right, with colors matching the lines precisely.
- Lines are ordered vertically from top (red) to bottom (blue), reflecting decreasing *f₂* values for a given *f₁*.
3. **Data Points**:
- No discrete data points are marked; the lines are continuous and represent theoretical trade-offs.
### Key Observations
- **Linear Trade-offs**: All solutions lie on straight lines, suggesting a linear relationship between the two objectives in the OneMinMax problem.
- **Pareto Dominance**: The red line dominates all others (no solution improves *f₂* without worsening *f₁*), while the blue line is the most efficient (lowest *f₂* for any *f₁*).
- **Spacing**: The vertical spacing between lines increases as *f₁* decreases, indicating diminishing returns in optimizing *f₂* at lower *f₁* values.
### Interpretation
The chart demonstrates how NSGA-II balances conflicting objectives in the OneMinMax problem. The linear Pareto front implies that the algorithm efficiently explores the solution space, generating diverse non-dominated solutions. The slope of -1 for all lines suggests equal weighting of the two objectives in this specific problem setup. The absence of curved fronts indicates that the OneMinMax problem may have inherent linearity, or the NSGA-II parameters (e.g., population size *N=n+1*) favor linear approximations. This visualization highlights the algorithm’s ability to identify optimal trade-offs, critical for multi-objective decision-making.