# Technical Document Analysis: ORM Verses PRM Line Chart
## 1. Chart Title
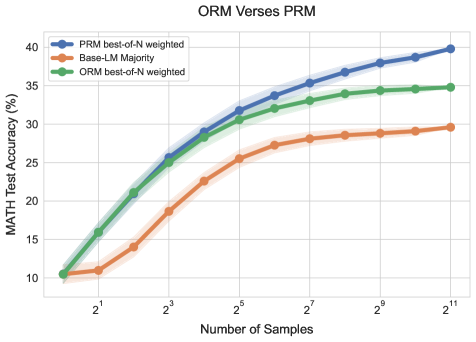
- **Title**: "ORM Verses PRM"
## 2. Axes
- **X-Axis**:
- Label: "Number of Samples"
- Scale: Logarithmic (2¹ to 2¹¹)
- Tick Marks: 2¹, 2³, 2⁵, 2⁷, 2⁹, 2¹¹
- **Y-Axis**:
- Label: "MATH Test Accuracy (%)"
- Range: 10% to 40%
- Tick Marks: 10%, 15%, 20%, 25%, 30%, 35%, 40%
## 3. Legend
- **Placement**: Top-left corner
- **Entries**:
- **Blue Circle**: "PRM best-of-N weighted"
- **Orange Circle**: "Base-LM Majority"
- **Green Circle**: "ORM best-of-N weighted"
## 4. Data Series & Trends
### A. PRM best-of-N weighted (Blue Line)
- **Trend**: Steady upward slope from 10% to 40%.
- **Key Data Points**:
- 2¹: 10%
- 2³: 26%
- 2⁵: 32%
- 2⁷: 35%
- 2⁹: 38%
- 2¹¹: 40%
### B. Base-LM Majority (Orange Line)
- **Trend**: Rapid initial increase, then plateau.
- **Key Data Points**:
- 2¹: 10%
- 2³: 18%
- 2⁵: 25%
- 2⁷: 28%
- 2⁹: 29%
- 2¹¹: 30%
### C. ORM best-of-N weighted (Green Line)
- **Trend**: Consistent upward slope, slightly less steep than PRM.
- **Key Data Points**:
- 2¹: 10%
- 2³: 24%
- 2⁵: 30%
- 2⁷: 33%
- 2⁹: 34%
- 2¹¹: 35%
## 5. Spatial Grounding
- **Legend Coordinates**: Top-left corner (exact [x, y] unspecified in image).
- **Main Chart Area**: Central region bounded by axes and gridlines.
## 6. Data Table Reconstruction
| Number of Samples | PRM best-of-N weighted (%) | Base-LM Majority (%) | ORM best-of-N weighted (%) |
|--------------------|----------------------------|----------------------|----------------------------|
| 2¹ (2) | 10 | 10 | 10 |
| 2³ (8) | 26 | 18 | 24 |
| 2⁵ (32) | 32 | 25 | 30 |
| 2⁷ (128) | 35 | 28 | 33 |
| 2⁹ (512) | 38 | 29 | 34 |
| 2¹¹ (2048) | 40 | 30 | 35 |
## 7. Verification Notes
- **Color Consistency**: All data points match legend colors (blue = PRM, orange = Base-LM, green = ORM).
- **Trend Logic**:
- PRM (blue) and ORM (green) lines show continuous improvement with scale.
- Base-LM (orange) plateaus after 2⁷ samples, confirming diminishing returns.
## 8. Missing Elements
- No additional text, heatmaps, or diagrams present.
- No non-English content detected.
## 9. Summary
The chart compares three models (PRM, Base-LM, ORM) across increasing sample sizes (logarithmic scale). PRM achieves the highest accuracy (40% at 2¹¹ samples), followed by ORM (35%) and Base-LM (30%), which plateaus early. All models start at 10% accuracy for 2¹ samples.