\n
## Diagram: REASON Algorithm Optimization Pipeline
### Overview
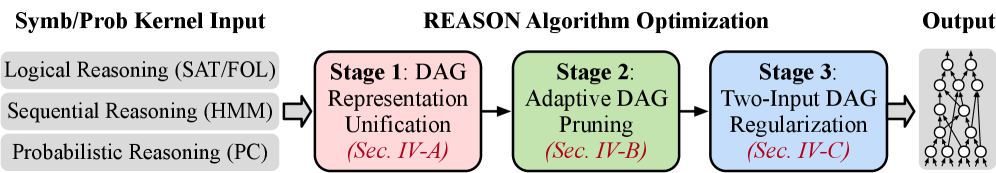
The image depicts a diagram illustrating the REASON algorithm optimization pipeline. It shows a flow of information from a "Symb/Prob Kernel Input" through three stages of optimization to a final "Output". The diagram uses rectangular boxes to represent stages and arrows to indicate the flow of data.
### Components/Axes
The diagram is divided into four main sections:
1. **Symb/Prob Kernel Input:** This section lists three input types:
* Logical Reasoning (SAT/FOL)
* Sequential Reasoning (HMM)
* Probabilistic Reasoning (PC)
2. **REASON Algorithm Optimization:** This section contains three stages:
* Stage 1: DAG Representation Unification (Sec. IV-A) - Represented by a pink rectangle.
* Stage 2: Adaptive DAG Pruning (Sec. IV-B) - Represented by a green rectangle.
* Stage 3: Two-Input DAG Regularization (Sec. IV-C) - Represented by a blue rectangle.
3. **Output:** This section shows a network of interconnected nodes, resembling a neural network or graph structure.
4. **Arrows:** Arrows indicate the direction of data flow from the input to the output, passing through each stage of optimization.
### Detailed Analysis or Content Details
The diagram shows a sequential process. The input section lists three different reasoning approaches. These inputs are fed into the first stage, "DAG Representation Unification," which is referenced as "Sec. IV-A". The output of this stage is then passed to "Adaptive DAG Pruning" (Sec. IV-B), and finally to "Two-Input DAG Regularization" (Sec. IV-C). The final output is a complex network of nodes connected by arrows. The output network has approximately 10 nodes in the top layer and 6 nodes in the bottom layer. Each node has multiple incoming and outgoing connections.
### Key Observations
The diagram highlights a pipeline for optimizing reasoning algorithms. The use of "DAG" (Directed Acyclic Graph) in the stage names suggests that the algorithm relies on graph-based representations. The progression from unification to pruning to regularization indicates a refinement process, aiming to simplify and improve the reasoning process. The final output is a complex network, suggesting the algorithm produces a structured representation of the reasoning process.
### Interpretation
The diagram illustrates a method for transforming symbolic and probabilistic reasoning kernels into a unified and optimized form. The REASON algorithm appears to leverage DAGs as an intermediate representation, allowing for manipulation and refinement through the three stages. The "Unification" stage likely aims to convert different reasoning approaches into a common graph format. "Pruning" suggests removing unnecessary connections or nodes to simplify the graph. "Regularization" likely involves adjusting the graph structure to improve its performance or generalization ability. The final output, a complex network, could represent a learned model or a refined reasoning engine. The references to "Sec. IV-A", "Sec. IV-B", and "Sec. IV-C" indicate that detailed explanations of each stage can be found in Section IV of a related document. The diagram suggests a focus on improving the efficiency and effectiveness of reasoning algorithms by leveraging graph-based representations and optimization techniques.