## Flowchart: REASON Algorithm Optimization
### Overview
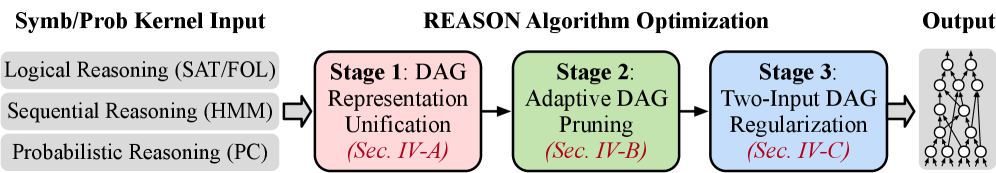
The flowchart illustrates a three-stage pipeline for optimizing a reasoning algorithm, starting from symbolic/probabilistic kernel inputs and culminating in a structured output network. Each stage is color-coded (pink, green, blue) and labeled with technical terms, with arrows indicating sequential processing.
### Components/Axes
- **Input Section**:
- **Title**: "Symb/Prob Kernel Input"
- **Components**:
1. Logical Reasoning (SAT/FOL)
2. Sequential Reasoning (HMM)
3. Probabilistic Reasoning (PC)
- **Stages**:
1. **Stage 1**: DAG Representation Unification (Sec. IV-A)
- Color: Pink
- Description: Unifies DAG representations.
2. **Stage 2**: Adaptive DAG Pruning (Sec. IV-B)
- Color: Green
- Description: Prunes DAGs adaptively.
3. **Stage 3**: Two-Input DAG Regularization (Sec. IV-C)
- Color: Blue
- Description: Regularizes DAGs using two inputs.
- **Output Section**:
- **Title**: "Output"
- **Visualization**: Network of interconnected nodes (circles) with directed edges.
### Detailed Analysis
- **Flow Direction**:
Input → Stage 1 → Stage 2 → Stage 3 → Output.
- **Textual Labels**:
- All stage titles include section references (e.g., "Sec. IV-A") in red parentheses.
- No numerical values or legends are present.
- **Color Coding**:
- Stages are distinctly colored (pink, green, blue) but lack a formal legend.
- Arrows are gray, emphasizing process flow.
### Key Observations
- The pipeline emphasizes **progressive refinement**: unification → pruning → regularization.
- Section references (e.g., Sec. IV-A) suggest alignment with a technical document’s subsections.
- The output network implies a structured, interconnected result, likely a DAG.
### Interpretation
This flowchart represents a **modular algorithmic framework** for reasoning tasks. Each stage builds on the prior:
1. **Stage 1** standardizes input representations into a unified DAG structure.
2. **Stage 2** optimizes the DAG by removing redundant or irrelevant components.
3. **Stage 3** enhances robustness by regularizing the DAG with dual inputs, likely balancing competing objectives (e.g., accuracy vs. complexity).
The absence of numerical data suggests this is a **conceptual diagram** rather than an empirical analysis. The use of section references implies the stages are elaborated in a technical paper, with the flowchart serving as a high-level overview. The output network’s structure hints at applications in domains requiring hierarchical or probabilistic reasoning (e.g., AI, formal logic).