\n
## Line Chart: Validation Score vs. Training Step
### Overview
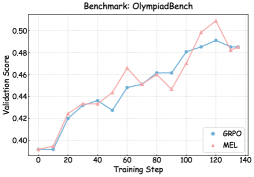
This image presents a line chart illustrating the validation score of two models, GRP0 and MEL, as a function of the training step. The chart appears to track the performance of these models during a training process on the "OlympiadBench" benchmark.
### Components/Axes
* **Title:** Benchmark: OlympiadBench (positioned at the top-center)
* **X-axis:** Training Step (ranging from approximately 0 to 140, with markers at 20, 40, 60, 80, 100, 120, and 140)
* **Y-axis:** Validation Score (ranging from approximately 0.40 to 0.52, with markers at 0.42, 0.44, 0.46, 0.48, and 0.50)
* **Legend:** Located in the top-right corner.
* GRP0 (represented by a light blue line with circular markers)
* MEL (represented by a light red line with triangular markers)
### Detailed Analysis
**GRP0 (Light Blue Line):**
The GRP0 line generally slopes upward, indicating an increasing validation score with increasing training steps.
* At Training Step 0: Validation Score ≈ 0.41
* At Training Step 20: Validation Score ≈ 0.43
* At Training Step 40: Validation Score ≈ 0.44
* At Training Step 60: Validation Score ≈ 0.45
* At Training Step 80: Validation Score ≈ 0.45
* At Training Step 100: Validation Score ≈ 0.46
* At Training Step 120: Validation Score ≈ 0.49
* At Training Step 140: Validation Score ≈ 0.48
**MEL (Light Red Line):**
The MEL line also generally slopes upward, but exhibits more fluctuation than GRP0.
* At Training Step 0: Validation Score ≈ 0.41
* At Training Step 20: Validation Score ≈ 0.43
* At Training Step 40: Validation Score ≈ 0.44
* At Training Step 60: Validation Score ≈ 0.47
* At Training Step 80: Validation Score ≈ 0.45
* At Training Step 100: Validation Score ≈ 0.48
* At Training Step 120: Validation Score ≈ 0.51
* At Training Step 140: Validation Score ≈ 0.48
### Key Observations
* Both models show an increasing trend in validation score as training progresses.
* The MEL model appears to achieve a higher peak validation score (around 0.51) compared to GRP0 (around 0.49).
* The MEL model exhibits more variability in its validation score, with a noticeable dip around Training Step 80.
* Both models appear to plateau or slightly decrease in performance towards the end of the training process (between Training Step 120 and 140).
### Interpretation
The chart demonstrates the learning curves of two models (GRP0 and MEL) on the OlympiadBench benchmark. The upward trend in validation score for both models indicates that they are learning and improving their performance with increased training. The higher peak score achieved by MEL suggests that it may be a more effective model for this benchmark, although its greater variability could indicate a higher sensitivity to training data or hyperparameters. The plateauing or slight decrease in performance towards the end of training suggests that both models may be approaching their optimal performance level or are starting to overfit to the training data. Further investigation would be needed to determine the cause of this plateau and whether additional training or regularization techniques could improve performance. The difference in the smoothness of the curves could indicate different levels of regularization or different optimization algorithms used during training.