## Bar Charts: Passed Proofs and Passed Step Proofs in Different Attempts
### Overview
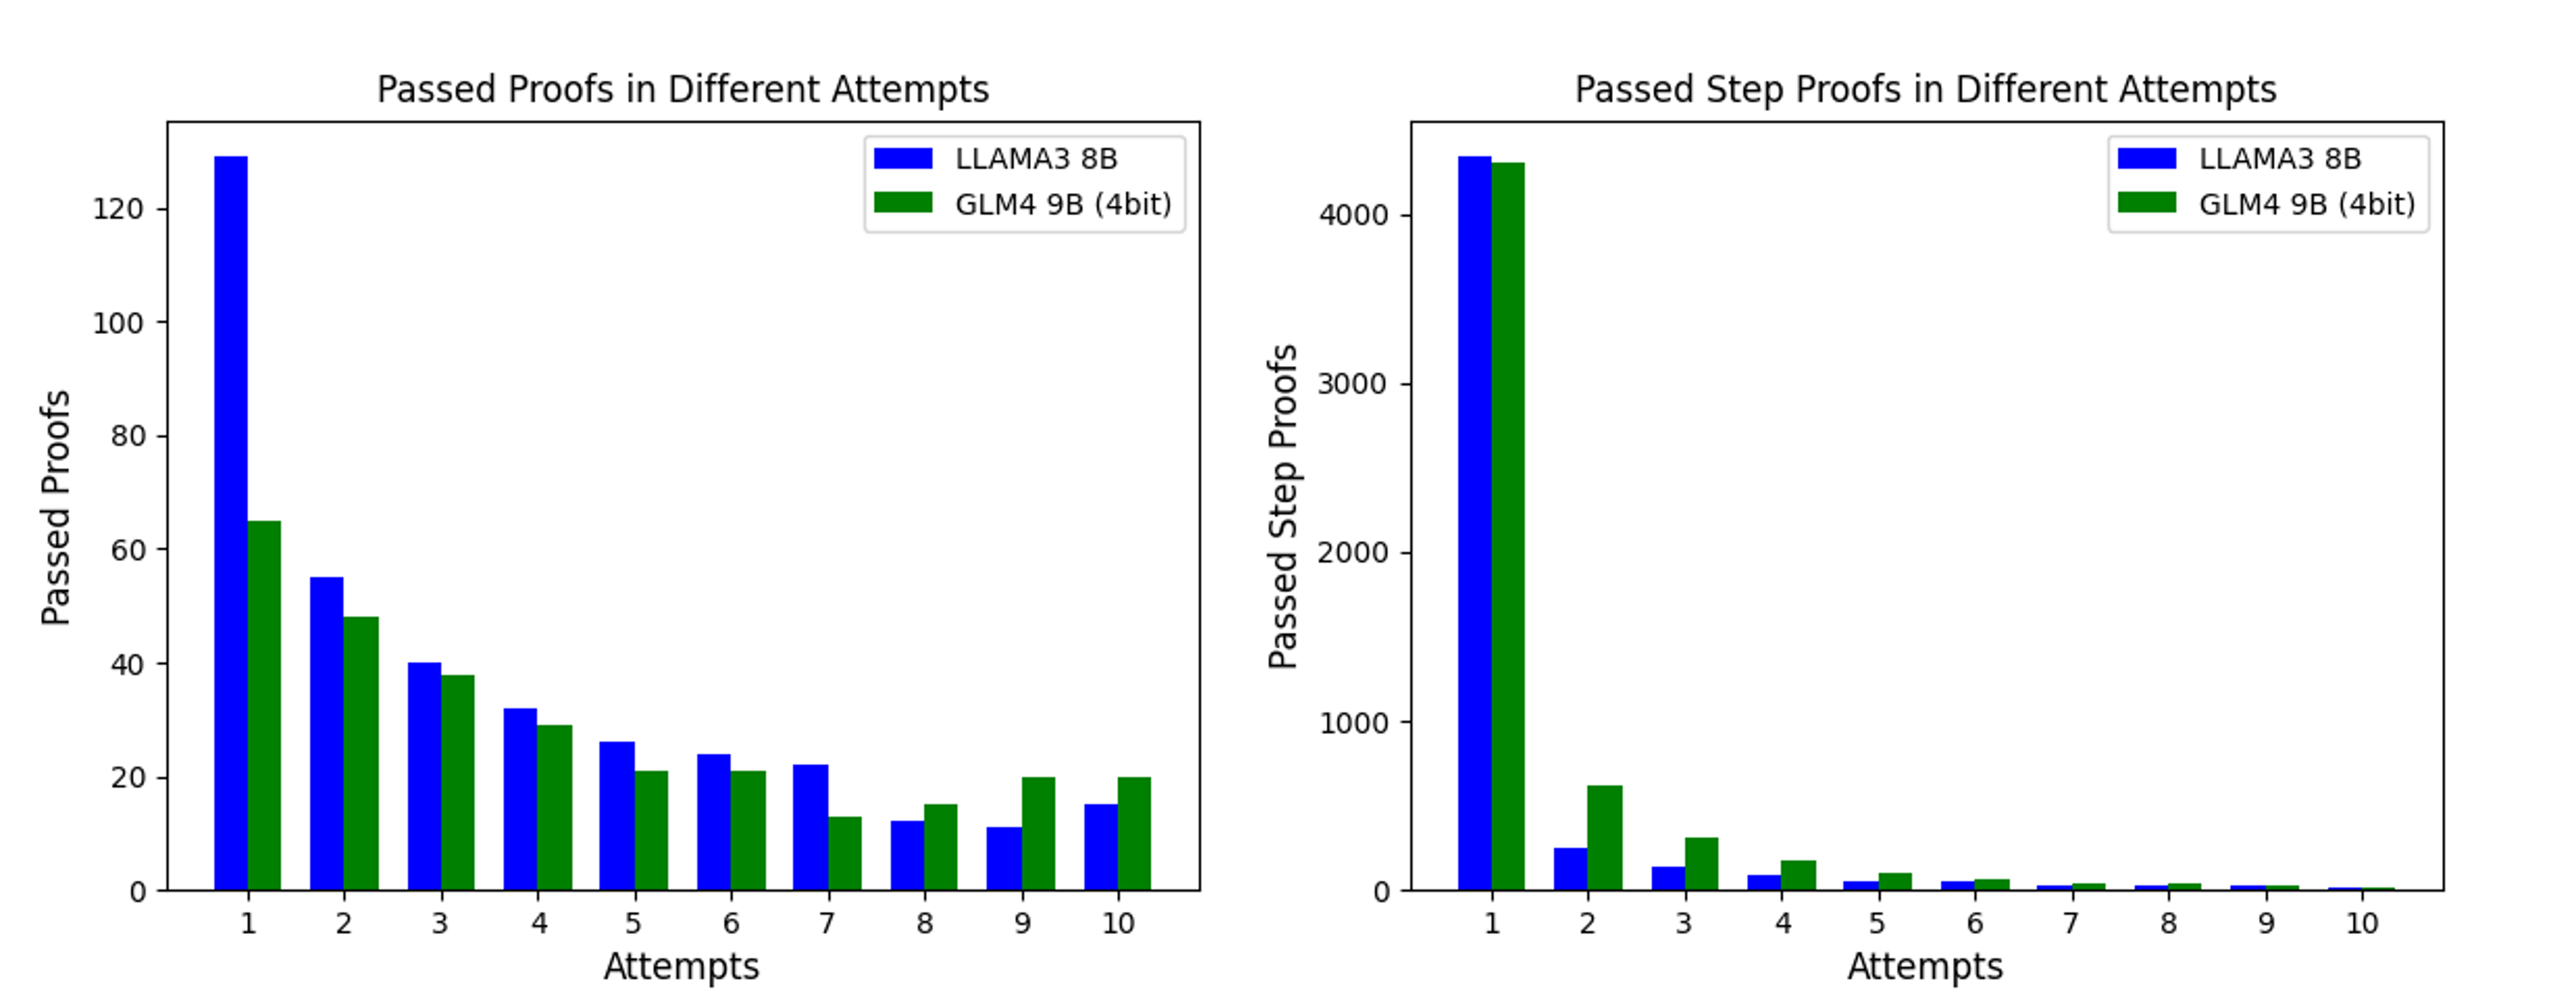
The image contains two bar charts side-by-side. Both charts compare the performance of two models, LLAMA3 8B and GLM4 9B (4bit), across different attempts. The left chart shows the number of "Passed Proofs," while the right chart shows the number of "Passed Step Proofs." The x-axis represents the attempt number (from 1 to 10), and the y-axis represents the count of proofs or step proofs.
### Components/Axes
**Left Chart:**
* **Title:** Passed Proofs in Different Attempts
* **X-axis:** Attempts (labeled 1 to 10)
* **Y-axis:** Passed Proofs (scale from 0 to 120)
* **Legend:**
* Blue: LLAMA3 8B
* Green: GLM4 9B (4bit)
**Right Chart:**
* **Title:** Passed Step Proofs in Different Attempts
* **X-axis:** Attempts (labeled 1 to 10)
* **Y-axis:** Passed Step Proofs (scale from 0 to 4000)
* **Legend:**
* Blue: LLAMA3 8B
* Green: GLM4 9B (4bit)
### Detailed Analysis
**Left Chart (Passed Proofs):**
* **LLAMA3 8B (Blue):**
* Attempt 1: Approximately 128
* Attempt 2: Approximately 55
* Attempt 3: Approximately 40
* Attempt 4: Approximately 32
* Attempt 5: Approximately 27
* Attempt 6: Approximately 23
* Attempt 7: Approximately 22
* Attempt 8: Approximately 13
* Attempt 9: Approximately 12
* Attempt 10: Approximately 17
* Trend: Decreases sharply from attempt 1 to 2, then decreases gradually until attempt 9, then increases slightly at attempt 10.
* **GLM4 9B (4bit) (Green):**
* Attempt 1: Approximately 65
* Attempt 2: Approximately 48
* Attempt 3: Approximately 38
* Attempt 4: Approximately 29
* Attempt 5: Approximately 21
* Attempt 6: Approximately 21
* Attempt 7: Approximately 13
* Attempt 8: Approximately 12
* Attempt 9: Approximately 20
* Attempt 10: Approximately 20
* Trend: Decreases sharply from attempt 1 to 2, then decreases gradually until attempt 8, then increases slightly at attempts 9 and 10.
**Right Chart (Passed Step Proofs):**
* **LLAMA3 8B (Blue):**
* Attempt 1: Approximately 4300
* Attempt 2: Approximately 300
* Attempt 3: Approximately 100
* Attempt 4: Approximately 50
* Attempt 5: Approximately 30
* Attempt 6: Approximately 20
* Attempt 7: Approximately 20
* Attempt 8: Approximately 15
* Attempt 9: Approximately 10
* Attempt 10: Approximately 10
* Trend: Decreases sharply from attempt 1 to 2, then decreases gradually until attempt 10.
* **GLM4 9B (4bit) (Green):**
* Attempt 1: Approximately 4350
* Attempt 2: Approximately 650
* Attempt 3: Approximately 250
* Attempt 4: Approximately 150
* Attempt 5: Approximately 50
* Attempt 6: Approximately 40
* Attempt 7: Approximately 30
* Attempt 8: Approximately 20
* Attempt 9: Approximately 15
* Attempt 10: Approximately 15
* Trend: Decreases sharply from attempt 1 to 2, then decreases gradually until attempt 10.
### Key Observations
* In both charts, the number of passed proofs/step proofs decreases as the attempt number increases.
* In the "Passed Proofs" chart, LLAMA3 8B generally outperforms GLM4 9B (4bit) across all attempts.
* In the "Passed Step Proofs" chart, GLM4 9B (4bit) slightly outperforms LLAMA3 8B in the first attempt, but LLAMA3 8B generally outperforms GLM4 9B (4bit) across all attempts.
* The most significant drop in performance occurs between the first and second attempts for both models in both charts.
### Interpretation
The data suggests that both models are more successful in earlier attempts, with performance declining as the number of attempts increases. This could be due to the models learning from previous attempts and adjusting their strategies, or it could indicate that the task becomes more difficult with each subsequent attempt. LLAMA3 8B generally performs better than GLM4 9B (4bit) in terms of "Passed Proofs," while GLM4 9B (4bit) performs slightly better in the first attempt for "Passed Step Proofs." The sharp decline in performance between the first and second attempts highlights the importance of initial conditions or strategies in the success of these models.