\n
## Bar Charts: Passed Proofs and Passed Step Proofs in Different Attempts
### Overview
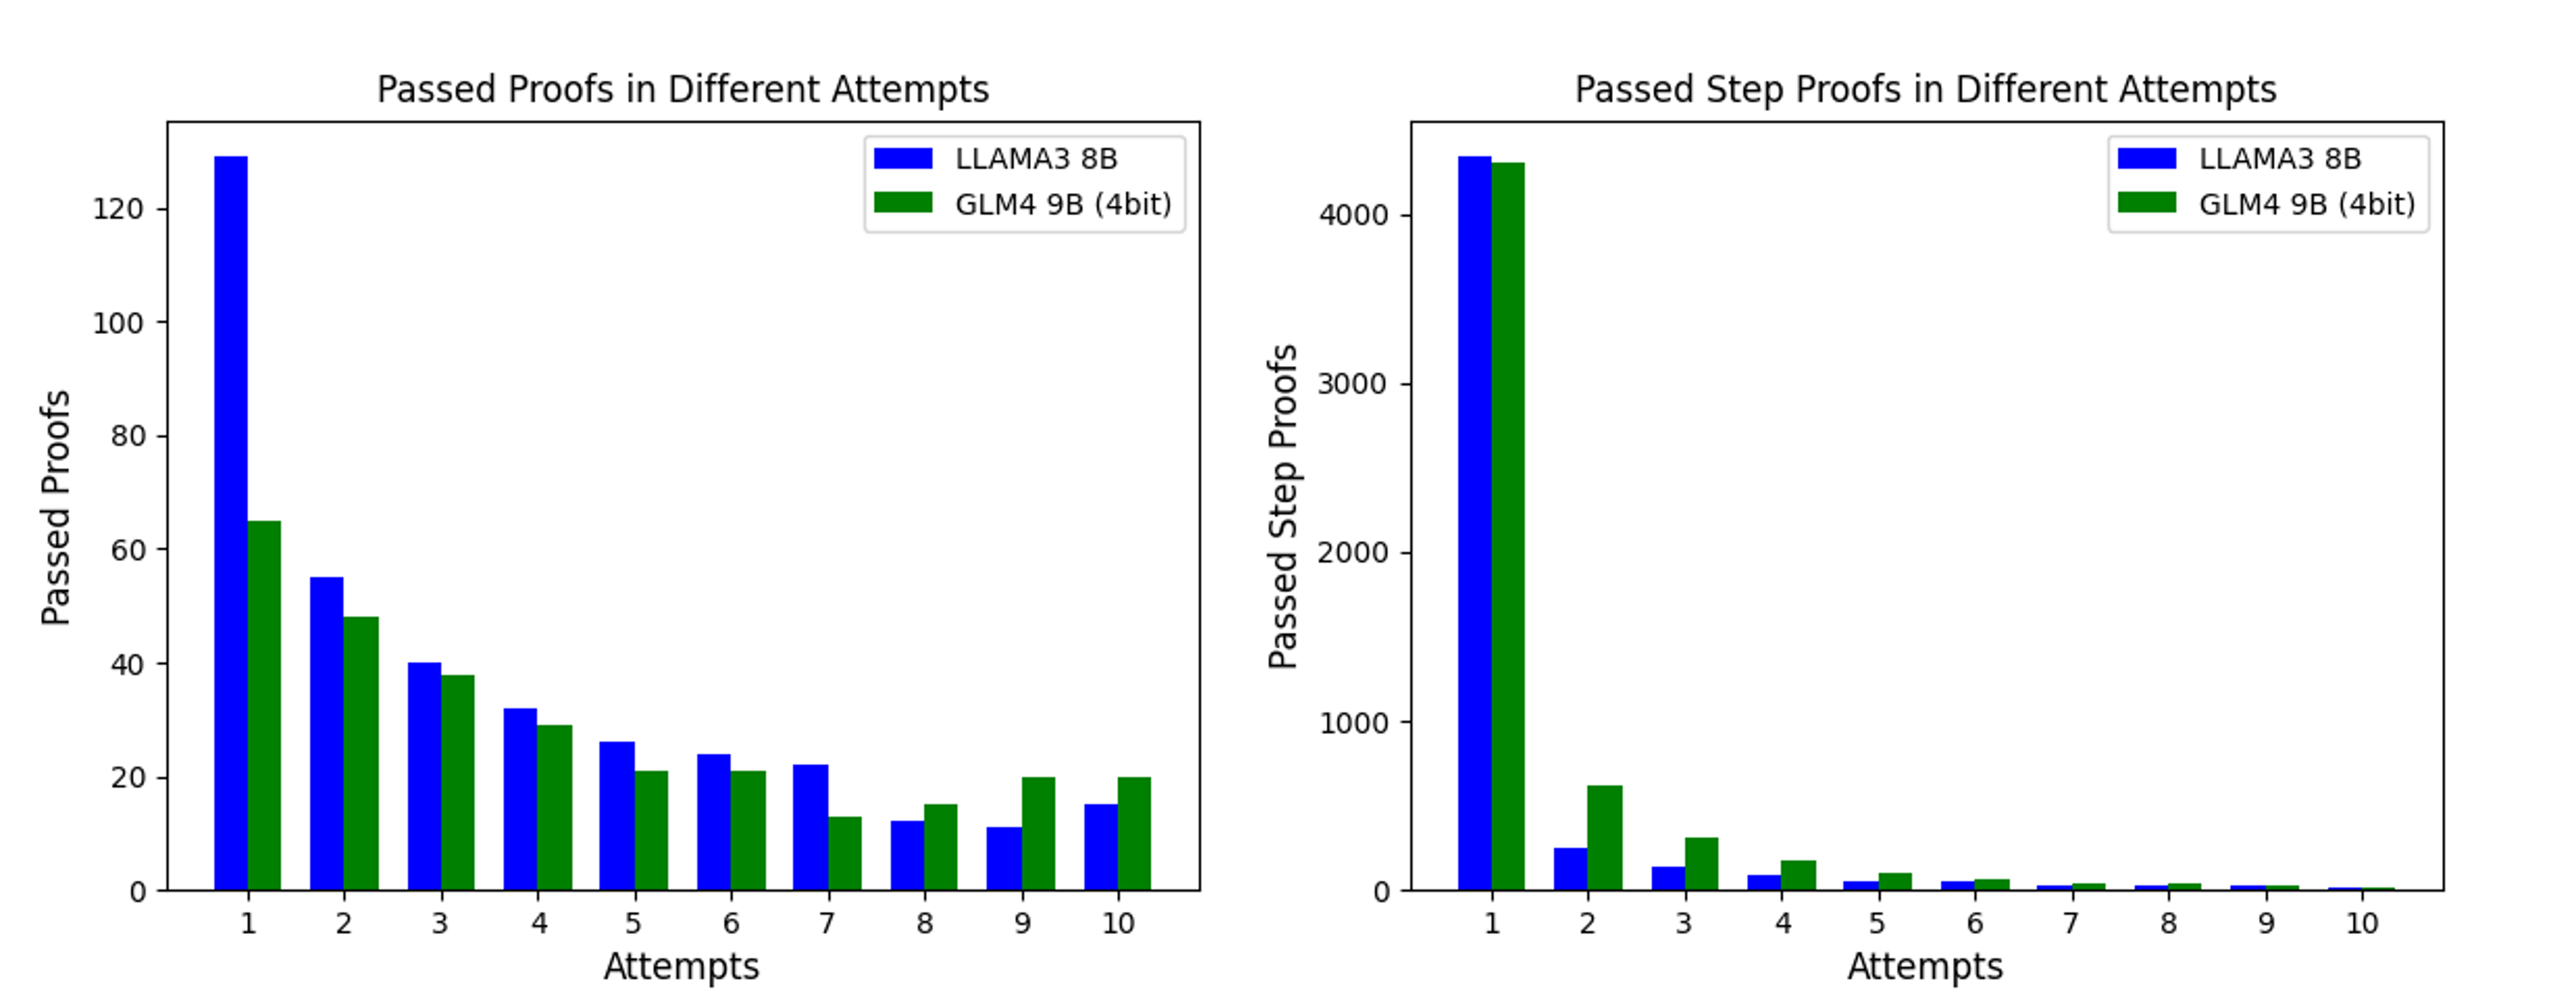
The image presents two bar charts side-by-side. Both charts compare the performance of two language models, LLAMA3 8B and GLM4 9B (4bit), across different attempts at a task involving proofs. The left chart displays the number of "Passed Proofs," while the right chart shows the number of "Passed Step Proofs." The x-axis in both charts represents the attempt number, ranging from 1 to 10.
### Components/Axes
**Chart 1: Passed Proofs in Different Attempts**
* **Title:** "Passed Proofs in Different Attempts"
* **X-axis:** "Attempts" (1 to 10)
* **Y-axis:** "Passed Proofs" (Scale from 0 to 120)
* **Legend:**
* Blue: LLAMA3 8B
* Green: GLM4 9B (4bit)
**Chart 2: Passed Step Proofs in Different Attempts**
* **Title:** "Passed Step Proofs in Different Attempts"
* **X-axis:** "Attempts" (1 to 10)
* **Y-axis:** "Passed Step Proofs" (Scale from 0 to 4000)
* **Legend:**
* Blue: LLAMA3 8B
* Green: GLM4 9B (4bit)
### Detailed Analysis or Content Details
**Chart 1: Passed Proofs**
* **LLAMA3 8B (Blue):** The blue bars show a decreasing trend in passed proofs as the attempt number increases.
* Attempt 1: ~125
* Attempt 2: ~55
* Attempt 3: ~45
* Attempt 4: ~30
* Attempt 5: ~25
* Attempt 6: ~20
* Attempt 7: ~15
* Attempt 8: ~15
* Attempt 9: ~18
* Attempt 10: ~20
* **GLM4 9B (4bit) (Green):** The green bars also show a decreasing trend, but the values are generally lower than LLAMA3 8B.
* Attempt 1: ~10
* Attempt 2: ~40
* Attempt 3: ~30
* Attempt 4: ~20
* Attempt 5: ~15
* Attempt 6: ~15
* Attempt 7: ~10
* Attempt 8: ~10
* Attempt 9: ~15
* Attempt 10: ~20
**Chart 2: Passed Step Proofs**
* **LLAMA3 8B (Blue):** The blue bars exhibit a sharp decline in passed step proofs after the first attempt.
* Attempt 1: ~4000
* Attempt 2: ~800
* Attempt 3: ~200
* Attempt 4: ~50
* Attempt 5: ~20
* Attempt 6: ~10
* Attempt 7: ~5
* Attempt 8: ~5
* Attempt 9: ~10
* Attempt 10: ~10
* **GLM4 9B (4bit) (Green):** The green bars also show a rapid decrease after the first attempt, with values consistently lower than LLAMA3 8B.
* Attempt 1: ~4000
* Attempt 2: ~600
* Attempt 3: ~100
* Attempt 4: ~20
* Attempt 5: ~10
* Attempt 6: ~5
* Attempt 7: ~5
* Attempt 8: ~5
* Attempt 9: ~5
* Attempt 10: ~5
### Key Observations
* Both models demonstrate a significant drop in performance (both passed proofs and passed step proofs) as the attempt number increases.
* LLAMA3 8B consistently outperforms GLM4 9B (4bit) in terms of both passed proofs and passed step proofs, especially in the initial attempts.
* The decline in performance is much more pronounced for "Passed Step Proofs" than for "Passed Proofs."
* The performance of both models appears to stabilize at a very low level after several attempts.
### Interpretation
The data suggests that both LLAMA3 8B and GLM4 9B (4bit) struggle to maintain consistent performance across multiple attempts at the proof-solving task. The initial high performance followed by a rapid decline could indicate that the models are sensitive to the specific formulation of the problem or that they quickly exhaust their initial knowledge or reasoning capabilities. The fact that LLAMA3 8B consistently outperforms GLM4 9B (4bit) suggests that the larger model (8B parameters vs. 9B 4bit) has a greater capacity for generalization or more robust reasoning abilities. The steeper decline in "Passed Step Proofs" compared to "Passed Proofs" implies that the models have more difficulty with the intermediate steps of the proof process than with the overall proof completion. This could be due to the complexity of the reasoning required for each step or the accumulation of errors over multiple steps. The stabilization at low performance levels after several attempts suggests that the models may be reaching a limit in their ability to learn or adapt to the task.