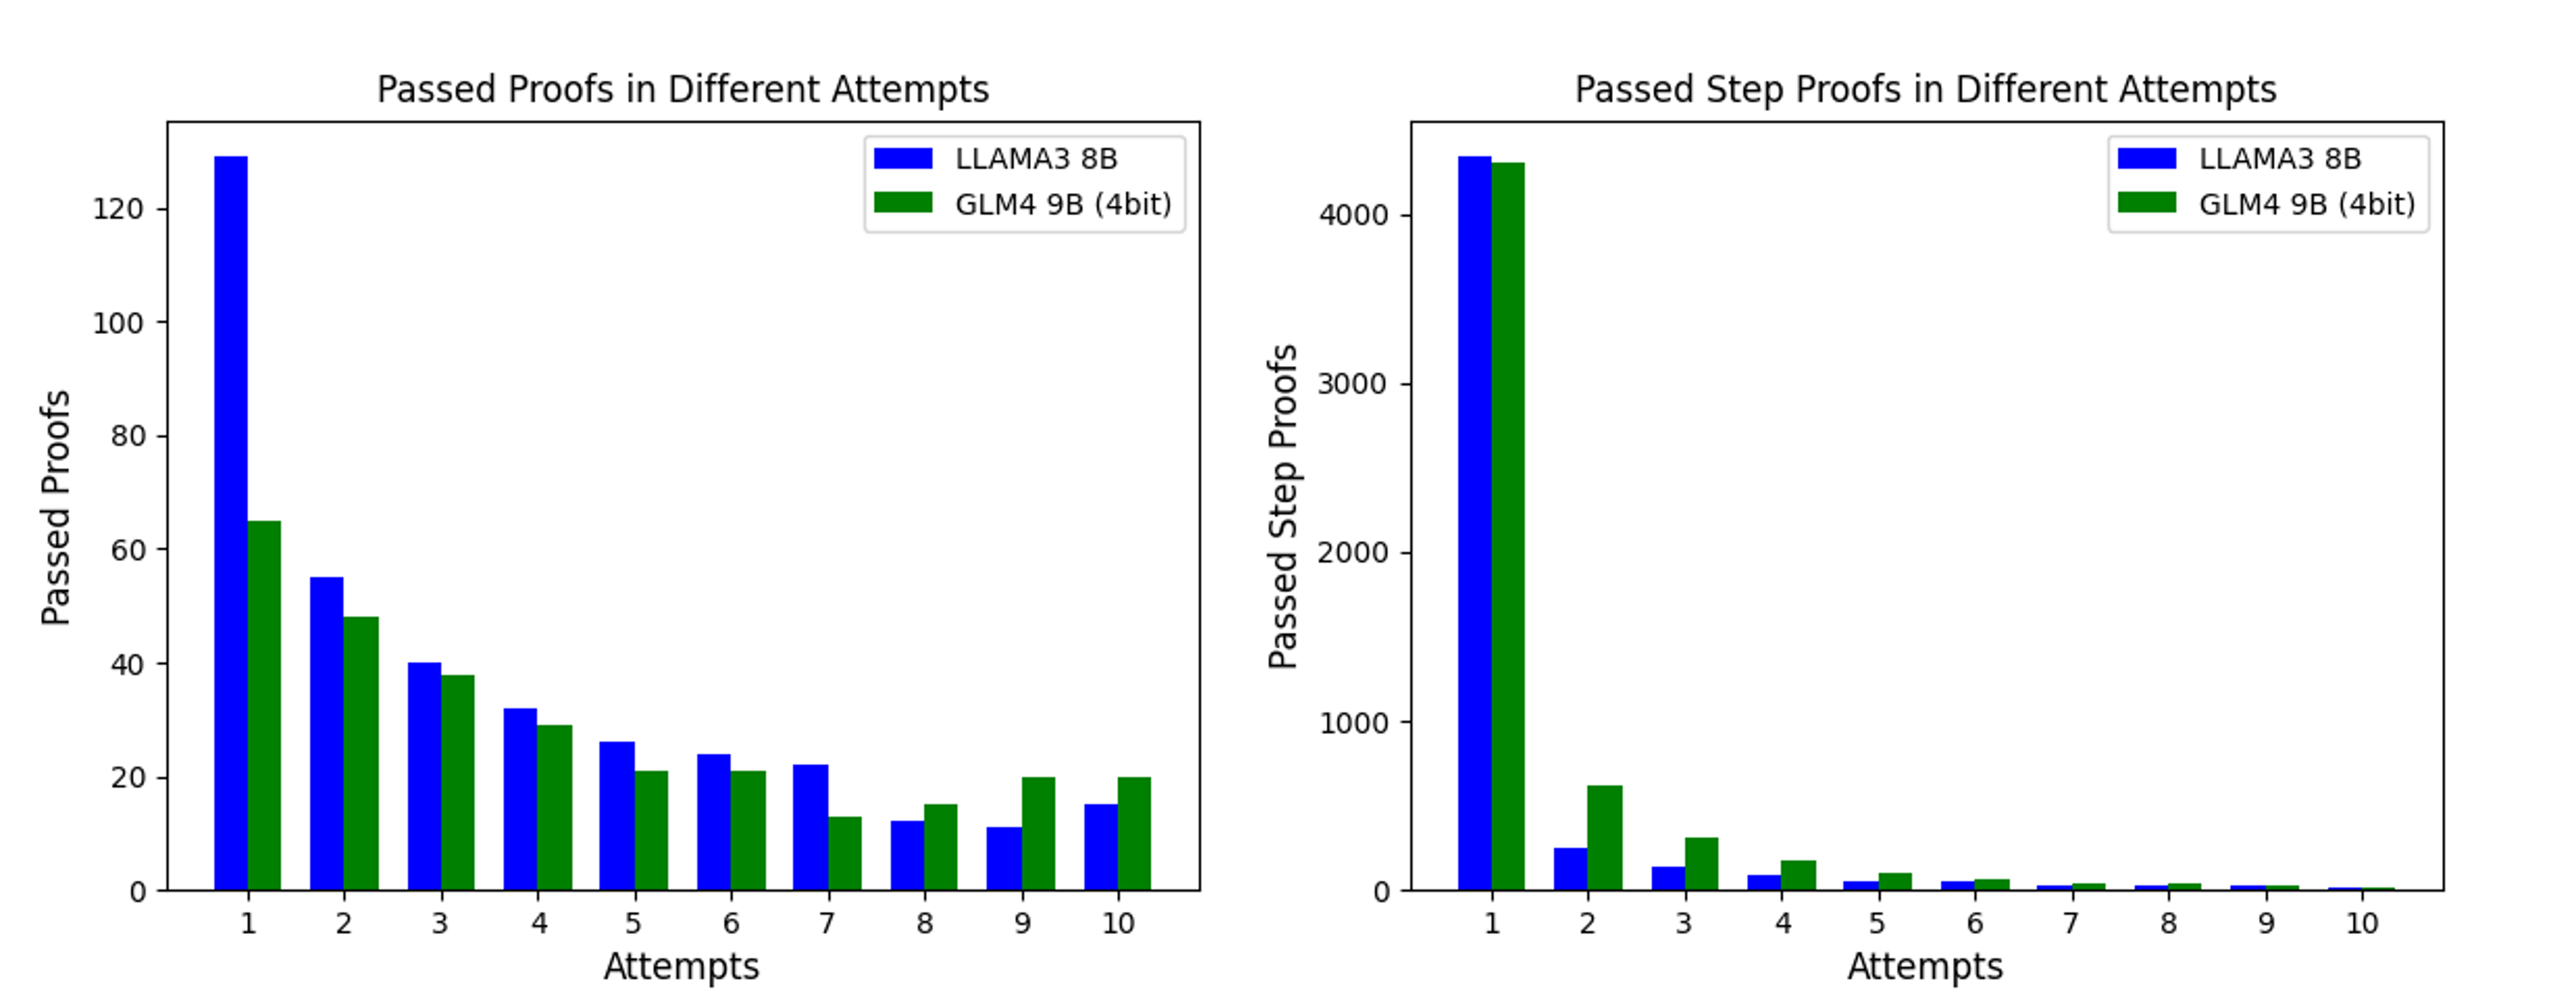
## Bar Charts: Passed Proofs and Step Proofs in Different Attempts
### Overview
The image contains two side-by-side bar charts comparing the performance of two AI models, **LLAMA3 8B** (blue) and **GLM4 9B (4bit)** (green), across 10 attempts. The left chart measures "Passed Proofs," while the right chart measures "Passed Step Proofs." Both charts show a decline in performance as the number of attempts increases.
### Components/Axes
#### Left Chart: Passed Proofs in Different Attempts
- **X-axis (Attempts)**: Labeled "Attempts," with discrete categories from 1 to 10.
- **Y-axis (Passed Proofs)**: Labeled "Passed Proofs," with a linear scale from 0 to 140.
- **Legend**: Located at the top-right corner, associating blue with LLAMA3 8B and green with GLM4 9B (4bit).
#### Right Chart: Passed Step Proofs in Different Attempts
- **X-axis (Attempts)**: Same as the left chart (1–10).
- **Y-axis (Passed Step Proofs)**: Labeled "Passed Step Proofs," with a linear scale from 0 to 4,500.
- **Legend**: Identical to the left chart, with blue for LLAMA3 8B and green for GLM4 9B (4bit).
### Detailed Analysis
#### Left Chart: Passed Proofs
- **LLAMA3 8B (Blue)**:
- Attempt 1: ~130
- Attempt 2: ~55
- Attempt 3: ~40
- Attempt 4: ~30
- Attempt 5: ~25
- Attempt 6: ~20
- Attempt 7: ~18
- Attempt 8: ~12
- Attempt 9: ~10
- Attempt 10: ~15
- **GLM4 9B (4bit) (Green)**:
- Attempt 1: ~65
- Attempt 2: ~45
- Attempt 3: ~38
- Attempt 4: ~28
- Attempt 5: ~22
- Attempt 6: ~20
- Attempt 7: ~12
- Attempt 8: ~15
- Attempt 9: ~20
- Attempt 10: ~20
#### Right Chart: Passed Step Proofs
- **LLAMA3 8B (Blue)**:
- Attempt 1: ~4,400
- Attempt 2: ~1,200
- Attempt 3: ~300
- Attempt 4: ~100
- Attempt 5: ~50
- Attempt 6: ~30
- Attempt 7: ~10
- Attempt 8: ~5
- Attempt 9: ~2
- Attempt 10: ~1
- **GLM4 9B (4bit) (Green)**:
- Attempt 1: ~4,300
- Attempt 2: ~1,400
- Attempt 3: ~600
- Attempt 4: ~200
- Attempt 5: ~100
- Attempt 6: ~50
- Attempt 7: ~30
- Attempt 8: ~15
- Attempt 9: ~5
- Attempt 10: ~2
### Key Observations
1. **Decline in Performance**: Both models show a consistent decline in passed proofs and step proofs as attempts increase.
2. **LLAMA3 8B Dominance**: LLAMA3 8B outperforms GLM4 9B (4bit) in both metrics, particularly in the first attempt.
3. **Step Proofs Scale**: The right chart’s y-axis spans a much larger range (0–4,500), suggesting step proofs are a more granular or cumulative metric.
4. **GLM4 Resilience**: GLM4 9B (4bit) shows a slower decline in passed proofs compared to LLAMA3 8B, though it remains consistently lower.
### Interpretation
- **Model Efficiency**: LLAMA3 8B achieves higher initial success but degrades faster with repeated attempts, possibly due to overfitting or resource constraints.
- **GLM4 Trade-off**: GLM4 9B (4bit) sacrifices initial performance for more sustained results, indicating better generalization or efficiency in later attempts.
- **Step Proofs Complexity**: The drastic drop in step proofs (right chart) suggests that later attempts involve increasingly complex or interdependent tasks, where both models struggle.
- **Anomaly in Attempt 10**: GLM4 9B (4bit) shows a slight uptick in passed proofs at attempt 10, which may indicate a recovery phase or data inconsistency.
This analysis highlights trade-offs between initial performance and long-term reliability, with implications for model selection depending on task requirements.