# Technical Document Extraction: Accuracy vs. Context Length
## 1. Image Classification and Overview
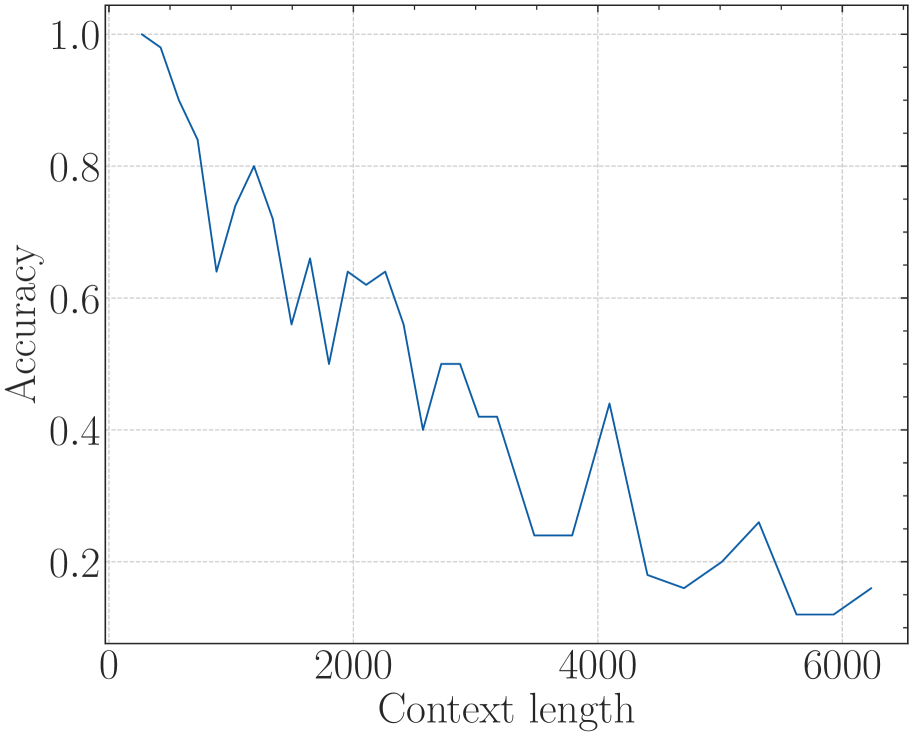
This image is a **line chart** depicting the relationship between model performance (Accuracy) and the amount of input data (Context length). The chart uses a dark blue line plotted against a light gray dashed grid.
## 2. Component Isolation
### Header/Title
* **Content:** None present.
### Main Chart Area
* **Y-Axis Label:** "Accuracy" (Vertical, left-aligned).
* **X-Axis Label:** "Context length" (Horizontal, bottom-centered).
* **Y-Axis Scale:** Linear, ranging from 0.0 to 1.0 with major ticks every 0.2.
* **X-Axis Scale:** Linear, ranging from 0 to 6000 with major ticks every 2000. Minor ticks are present every 500 units.
* **Grid:** Light gray dashed lines corresponding to major axis markers.
### Legend
* **Content:** None present. There is only a single data series.
---
## 3. Data Series Analysis
### Trend Verification
* **Series Name:** Accuracy (implied).
* **Color:** Dark Blue.
* **Visual Trend:** The line shows a **strong negative correlation**. It begins at the maximum value (1.0) at the shortest context length and follows a jagged, downward trajectory. While there are local "spikes" or recoveries (notably around context lengths 1200, 2000, and 4100), the overall macro trend is a significant decline as context length increases, eventually bottoming out below 0.2.
### Data Point Extraction (Estimated)
Based on the grid intersections and axis markers, the following data points represent the trajectory of the line:
| Context Length (X) | Accuracy (Y) | Notes |
| :--- | :--- | :--- |
| ~250 | 1.00 | Starting point / Peak accuracy |
| ~500 | 0.98 | Slight initial dip |
| ~800 | 0.85 | |
| ~1000 | 0.64 | Significant local drop |
| ~1250 | 0.80 | Local recovery peak |
| ~1500 | 0.56 | |
| ~1700 | 0.66 | |
| ~1850 | 0.50 | |
| ~2000 | 0.64 | Local recovery peak |
| ~2300 | 0.64 | Plateau |
| ~2600 | 0.40 | |
| ~2800 | 0.50 | |
| ~3000 | 0.50 | Plateau |
| ~3200 | 0.42 | |
| ~3500 | 0.24 | |
| ~3800 | 0.24 | Plateau |
| ~4100 | 0.44 | Significant late-stage spike |
| ~4400 | 0.18 | |
| ~4700 | 0.16 | Lowest point in series |
| ~5300 | 0.26 | |
| ~5600 | 0.12 | |
| ~5900 | 0.12 | Final plateau |
| ~6200 | 0.16 | Final data point |
---
## 4. Summary of Findings
The chart demonstrates a "Lost in the Middle" or context-exhaustion phenomenon. The model maintains near-perfect accuracy (1.0) at very short context lengths (under 500). However, as the context length increases toward 6000, the accuracy degrades significantly, fluctuating but ultimately losing approximately 85% of its initial performance, ending at an accuracy level between 0.12 and 0.16.