# Technical Document Extraction: Line Graph Analysis
## Image Description
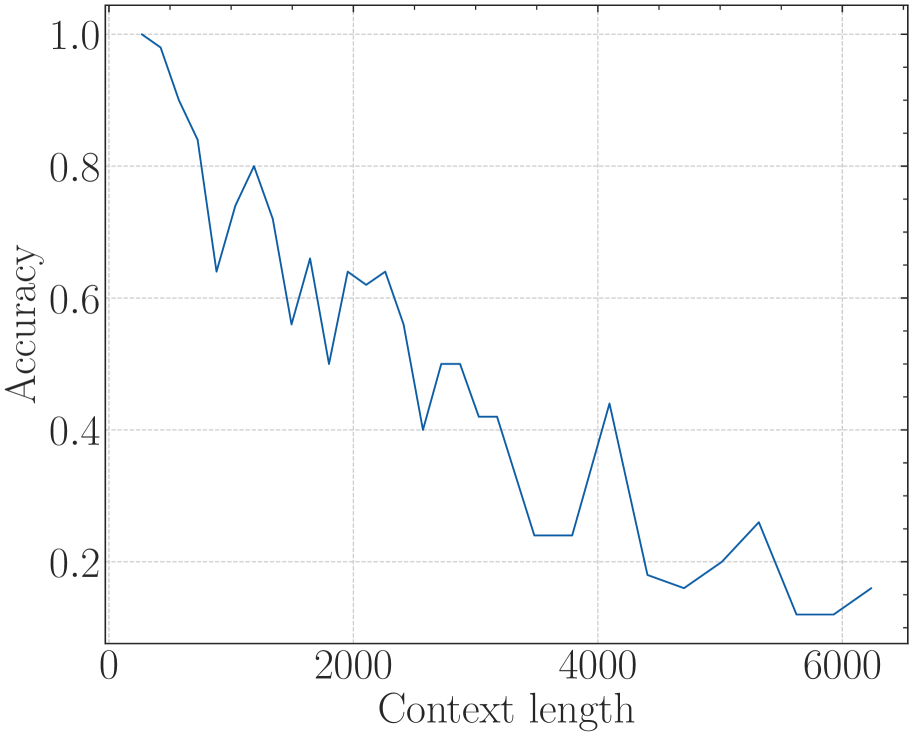
The image depicts a **line graph** illustrating the relationship between **context length** (x-axis) and **accuracy** (y-axis). The graph features a single blue line representing accuracy values across varying context lengths. The background includes a grid of dashed lines for reference.
---
## Key Components
### Axis Labels and Markers
- **X-axis (Horizontal):**
- Label: `Context length`
- Markers: `0`, `2000`, `4000`, `6000`
- **Y-axis (Vertical):**
- Label: `Accuracy`
- Markers: `0.2`, `0.4`, `0.6`, `0.8`, `1.0`
### Legend
- **Color:** Blue (matches the line color).
- **Placement:** Not explicitly visible in the image; inferred from the line color.
---
## Data Trends and Points
### Line Behavior
1. **Initial Decline:**
- Starts at `(0, 1.0)` and sharply decreases to `(1000, 0.6)`.
- Fluctuates between `0.6` and `0.8` until `x = 2000`.
2. **Mid-Range Volatility:**
- Drops to `0.4` at `x = 3000`, then rises to `0.5` at `x = 3500`.
- Declines to `0.2` at `x = 4500`, with a brief peak to `0.25` at `x = 5000`.
3. **Final Decline:**
- Reaches a low of `0.1` at `x = 5500`, then slightly increases to `0.15` at `x = 6000`.
### Extracted Data Points (Approximate)
| Context Length | Accuracy |
|----------------|----------|
| 0 | 1.0 |
| 500 | 0.9 |
| 1000 | 0.6 |
| 1500 | 0.8 |
| 2000 | 0.65 |
| 2500 | 0.6 |
| 3000 | 0.4 |
| 3500 | 0.5 |
| 4000 | 0.45 |
| 4500 | 0.2 |
| 5000 | 0.25 |
| 5500 | 0.1 |
| 6000 | 0.15 |
---
## Observations
- **General Trend:** Accuracy decreases as context length increases, with periodic fluctuations.
- **Critical Drop:** A significant decline occurs between `x = 0` and `x = 1000`, followed by stabilization until `x = 3000`.
- **Late-Stage Instability:** Accuracy becomes erratic after `x = 4000`, with sharp drops and minor recoveries.
---
## Notes
- No additional text, tables, or non-English content is present.
- The graph focuses solely on the relationship between context length and accuracy, with no legends or secondary data series.