## Chart: SmolLM2-1.7B Proportion of Flips vs. Iterations
### Overview
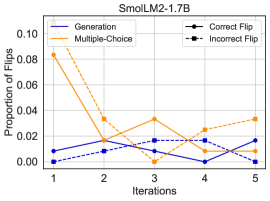
The image is a line chart titled "SmolLM2-1.7B" showing the proportion of flips across iterations for different methods: Generation, Multiple-Choice, Correct Flip, and Incorrect Flip. The x-axis represents iterations (1 to 5), and the y-axis represents the proportion of flips (0.00 to 0.10).
### Components/Axes
* **Title:** SmolLM2-1.7B
* **X-axis:** Iterations (1, 2, 3, 4, 5)
* **Y-axis:** Proportion of Flips (0.00, 0.02, 0.04, 0.06, 0.08, 0.10)
* **Legend:** Located in the top-left and top-right corners of the chart.
* **Generation:** Solid dark blue line
* **Multiple-Choice:** Solid orange line
* **Correct Flip:** Solid black line with circle markers
* **Incorrect Flip:** Dashed black line with square markers
### Detailed Analysis
* **Generation (Solid Dark Blue Line):** Starts at approximately 0.00 at iteration 1, increases to approximately 0.016 at iteration 2, decreases to approximately 0.00 at iteration 3, remains at approximately 0.00 at iteration 4, and increases to approximately 0.016 at iteration 5.
* **Multiple-Choice (Solid Orange Line):** Starts at approximately 0.084 at iteration 1, decreases to approximately 0.034 at iteration 2, increases to approximately 0.034 at iteration 3, decreases to approximately 0.00 at iteration 4, and increases to approximately 0.034 at iteration 5.
* **Correct Flip (Solid Black Line with Circle Markers):** Starts at approximately 0.00 at iteration 1, increases to approximately 0.016 at iteration 2, increases to approximately 0.016 at iteration 3, decreases to approximately 0.00 at iteration 4, and decreases to approximately 0.00 at iteration 5.
* **Incorrect Flip (Dashed Black Line with Square Markers):** Starts at approximately 0.00 at iteration 1, increases to approximately 0.016 at iteration 2, increases to approximately 0.016 at iteration 3, increases to approximately 0.016 at iteration 4, and increases to approximately 0.034 at iteration 5.
### Key Observations
* The "Multiple-Choice" method has the highest proportion of flips at the first iteration, but it decreases significantly in subsequent iterations.
* The "Generation" method has a relatively low proportion of flips across all iterations.
* The "Correct Flip" and "Incorrect Flip" methods have similar trends, with a slight increase in the proportion of flips over iterations.
### Interpretation
The chart compares the proportion of flips across iterations for different methods (Generation, Multiple-Choice, Correct Flip, and Incorrect Flip) in the SmolLM2-1.7B model. The "Multiple-Choice" method initially has a high proportion of flips, suggesting it might be more prone to errors in the early stages. However, its proportion decreases over iterations, indicating potential improvement. The "Generation" method consistently shows a low proportion of flips, suggesting it is more stable. The "Correct Flip" and "Incorrect Flip" methods show a gradual increase in the proportion of flips, which could be related to the model's learning process or specific characteristics of the data. Overall, the chart provides insights into the performance and stability of different methods in the SmolLM2-1.7B model.