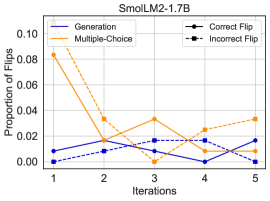
## Line Chart: Proportion of Flips vs. Iterations for SmolLM2-1.7B
### Overview
This line chart depicts the proportion of flips observed across different iterations for the SmolLM2-1.7B model, comparing performance between "Generation", "Multiple-Choice", "Correct Flip", and "Incorrect Flip" methods. The x-axis represents the iteration number (1 to 5), and the y-axis represents the proportion of flips, ranging from 0 to 0.10.
### Components/Axes
* **Title:** SmolLM2-1.7B (positioned at the top-center)
* **X-axis Label:** Iterations (positioned at the bottom-center)
* Axis Markers: 1, 2, 3, 4, 5
* **Y-axis Label:** Proportion of Flips (positioned at the left-center)
* Axis Scale: 0.00, 0.02, 0.04, 0.06, 0.08, 0.10
* **Legend:** Located at the top-right corner.
* Generation (Blue Solid Line)
* Multiple-Choice (Orange Solid Line)
* Correct Flip (Black Dashed Line)
* Incorrect Flip (Blue Dashed Line)
### Detailed Analysis
* **Generation (Blue Solid Line):** The line starts at approximately 0.01 at iteration 1, rises to a peak of around 0.022 at iteration 2, then declines to approximately 0.015 at iteration 3, fluctuates around 0.018 at iteration 4, and ends at approximately 0.021 at iteration 5. The trend is generally flat with minor fluctuations.
* **Multiple-Choice (Orange Solid Line):** This line begins at approximately 0.083 at iteration 1, drops sharply to around 0.038 at iteration 2, decreases further to approximately 0.032 at iteration 3, rises to around 0.04 at iteration 4, and ends at approximately 0.035 at iteration 5. The trend is a steep initial decline followed by a relatively stable plateau.
* **Correct Flip (Black Dashed Line):** The line starts at approximately 0.003 at iteration 1, rises to around 0.018 at iteration 2, declines to approximately 0.012 at iteration 3, decreases to around 0.008 at iteration 4, and ends at approximately 0.001 at iteration 5. The trend is initially upward, then a consistent decline.
* **Incorrect Flip (Blue Dashed Line):** The line begins at approximately 0.001 at iteration 1, rises to around 0.002 at iteration 2, declines to approximately 0.001 at iteration 3, rises to around 0.003 at iteration 4, and ends at approximately 0.003 at iteration 5. The trend is relatively flat with minor fluctuations.
### Key Observations
* The "Multiple-Choice" method starts with the highest proportion of flips, significantly higher than the other methods.
* The proportion of flips for "Multiple-Choice" decreases dramatically in the first two iterations.
* "Correct Flip" shows an initial increase in flips, followed by a consistent decrease.
* "Generation" and "Incorrect Flip" remain relatively stable throughout the iterations, with low proportions of flips.
* The "Incorrect Flip" line is consistently near zero.
### Interpretation
The data suggests that the "Multiple-Choice" method initially exhibits a high rate of changes (flips) but quickly stabilizes as iterations progress. This could indicate a rapid learning or adjustment phase. The "Generation" method shows a more consistent, albeit low, rate of flips, suggesting a slower or more gradual learning process. The "Correct Flip" method's initial increase followed by a decrease might indicate an initial exploration of correct solutions followed by convergence. The consistently low "Incorrect Flip" rate suggests that the model rarely makes incorrect changes.
The SmolLM2-1.7B model appears to adapt quickly when using the "Multiple-Choice" approach, as evidenced by the rapid decline in the proportion of flips. The other methods demonstrate more stable, lower rates of change. The differences in flip rates between the methods could be related to the complexity of the tasks or the effectiveness of the learning algorithms employed. The data provides insights into the model's learning dynamics and the relative performance of different methods.