## Line Chart: SmolLM2-1.7B - Proportion of Flips Over Iterations
### Overview
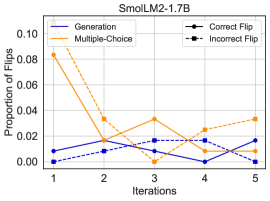
This is a line chart titled "SmolLM2-1.7B" that plots the "Proportion of Flips" against "Iterations" (from 1 to 5). It compares four different metrics or conditions, represented by distinct lines. The chart appears to track changes in model behavior or output characteristics across sequential iterations.
### Components/Axes
* **Title:** SmolLM2-1.7B (Top center)
* **Y-Axis:**
* **Label:** Proportion of Flips (Left side, vertical)
* **Scale:** Linear, ranging from 0.00 to 0.10, with major tick marks at 0.00, 0.02, 0.04, 0.06, 0.08, and 0.10.
* **X-Axis:**
* **Label:** Iterations (Bottom center)
* **Scale:** Discrete, with values 1, 2, 3, 4, and 5.
* **Legend:** Located in the top-right corner of the plot area. It defines four data series:
1. **Generation:** Solid blue line.
2. **Multiple-Choice:** Solid orange line.
3. **Correct Flip:** Black dashed line with circular markers.
4. **Incorrect Flip:** Black dashed line with square markers.
### Detailed Analysis
The following data points are approximate values extracted from the chart. The visual trend for each series is described first as a logic check.
1. **Generation (Blue Solid Line):**
* **Trend:** Fluctuates at a low level, dipping to near zero at iteration 3.
* **Data Points:**
* Iteration 1: ~0.01
* Iteration 2: ~0.02
* Iteration 3: ~0.00
* Iteration 4: ~0.01
* Iteration 5: ~0.02
2. **Multiple-Choice (Orange Solid Line):**
* **Trend:** Starts as the highest value, drops sharply, then shows a partial recovery with fluctuation.
* **Data Points:**
* Iteration 1: ~0.08
* Iteration 2: ~0.03
* Iteration 3: ~0.04
* Iteration 4: ~0.02
* Iteration 5: ~0.04
3. **Correct Flip (Black Dashed Line, Circle Markers):**
* **Trend:** Starts at zero, increases to a peak at iterations 3-4, then slightly decreases.
* **Data Points:**
* Iteration 1: 0.00
* Iteration 2: ~0.01
* Iteration 3: ~0.02
* Iteration 4: ~0.02
* Iteration 5: ~0.01
4. **Incorrect Flip (Black Dashed Line, Square Markers):**
* **Trend:** Starts at zero, remains low, and shows a very gradual increase with a peak at iteration 4.
* **Data Points:**
* Iteration 1: 0.00
* Iteration 2: 0.00
* Iteration 3: ~0.01
* Iteration 4: ~0.02
* Iteration 5: ~0.01
### Key Observations
* The **Multiple-Choice** proportion is dominant at the start (Iteration 1) but decreases significantly.
* The **Generation** proportion remains consistently low (≤0.02) across all iterations.
* Both **Correct Flip** and **Incorrect Flip** proportions start at zero and show a general, though modest, upward trend over the first four iterations before a slight dip at iteration 5.
* At Iteration 3, the **Generation** proportion drops to its minimum (~0.00), while the **Correct Flip** proportion reaches its peak (~0.02).
* The values for **Correct Flip** and **Incorrect Flip** are very similar, especially at iterations 4 and 5, where they are nearly indistinguishable on the chart.
### Interpretation
The chart likely illustrates the performance or behavioral evolution of the "SmolLM2-1.7B" model over five iterative steps. The "Proportion of Flips" could refer to changes in model outputs, such as flipping a prediction or answer choice.
* The high initial **Multiple-Choice** value suggests the model's outputs or errors were heavily concentrated in a multiple-choice context at the start. The subsequent drop indicates a shift away from this pattern.
* The consistently low **Generation** proportion suggests that "flips" related to open-ended generation tasks are rare throughout the process.
* The rise of **Correct Flip** and **Incorrect Flip** from zero implies that the iterative process introduces or increases the phenomenon of "flipping." The fact that correct and incorrect flips track closely together suggests the model's tendency to flip is not strongly correlated with the correctness of the flip at this scale.
* The overall low proportions (all below 0.10) indicate that "flipping" is a relatively infrequent event across all measured conditions. The most significant change is the redistribution from a high initial Multiple-Choice proportion to a more balanced, albeit low-level, distribution among the other metrics by iteration 5.