## Line Chart: SmolLM2-1.7B Performance Over Iterations
### Overview
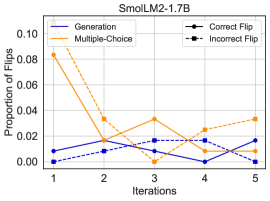
The chart visualizes the proportion of correct and incorrect flips for two tasks ("Generation" and "Multiple-Choice") across five iterations of a model. Data is represented by solid and dashed lines with corresponding markers.
### Components/Axes
- **X-axis**: Iterations (labeled 1 to 5)
- **Y-axis**: Proportion of Flips (ranging from 0.00 to 0.10)
- **Legend**:
- Top-left corner
- Blue line: "Generation" (solid = correct flips, dashed = incorrect flips)
- Orange line: "Multiple-Choice" (solid = correct flips, dashed = incorrect flips)
### Detailed Analysis
1. **Iteration 1**:
- Generation: Correct ≈ 0.005, Incorrect ≈ 0.002
- Multiple-Choice: Correct ≈ 0.085, Incorrect ≈ 0.003
2. **Iteration 2**:
- Generation: Correct ≈ 0.010, Incorrect ≈ 0.008
- Multiple-Choice: Correct ≈ 0.030, Incorrect ≈ 0.005
3. **Iteration 3**:
- Generation: Correct ≈ 0.015, Incorrect ≈ 0.007
- Multiple-Choice: Correct ≈ 0.035, Incorrect ≈ 0.002
4. **Iteration 4**:
- Generation: Correct ≈ 0.012, Incorrect ≈ 0.006
- Multiple-Choice: Correct ≈ 0.025, Incorrect ≈ 0.004
5. **Iteration 5**:
- Generation: Correct ≈ 0.018, Incorrect ≈ 0.009
- Multiple-Choice: Correct ≈ 0.035, Incorrect ≈ 0.005
### Key Observations
- **Multiple-Choice** starts with a high proportion of correct flips (0.085 at Iteration 1) but declines sharply by Iteration 3, then stabilizes.
- **Generation** shows a gradual increase in correct flips (from 0.005 to 0.018) with minor fluctuations.
- Incorrect flips for both tasks remain low (<0.01) but exhibit slight upward trends over iterations.
- Lines intersect around Iteration 3, indicating parity in performance between tasks at this point.
### Interpretation
The data suggests that the model's performance improves for **Generation** tasks over iterations, while **Multiple-Choice** performance deteriorates initially before stabilizing. This divergence may reflect task-specific challenges: Generation tasks might benefit from iterative refinement, whereas Multiple-Choice could involve overfitting or data distribution shifts. The low but rising incorrect flips hint at emerging errors as the model adapts, potentially due to increased complexity or noise in later iterations.