\n
## Box Plot: NSGA-II Performance on OneMinMax
### Overview
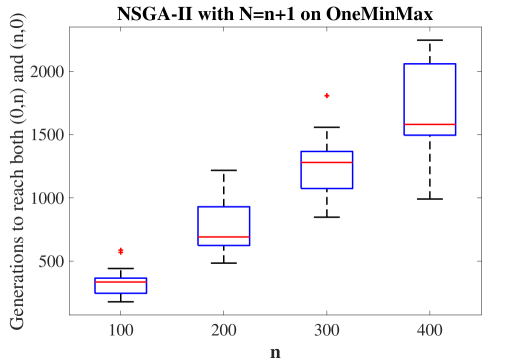
The image presents a series of box plots illustrating the relationship between the parameter 'n' and the number of generations required for the NSGA-II algorithm to reach both (0,n) and (n,0) on the OneMinMax problem. The x-axis represents the value of 'n', and the y-axis represents the number of generations.
### Components/Axes
* **Title:** "NSGA-II with N=n+1 on OneMinMax" - positioned at the top-center of the image.
* **X-axis Label:** "n" - positioned at the bottom-center of the image. The axis has markers at 100, 200, 300, and 400.
* **Y-axis Label:** "Generations to reach both (0,n) and (n,0)" - positioned on the left-center of the image. The axis ranges from approximately 0 to 2200, with tick marks at intervals of 500.
* **Data Series:** Four box plots, each corresponding to a different value of 'n' (100, 200, 300, 400).
* **Outliers:** Represented by red '+' symbols.
### Detailed Analysis
The box plots display the distribution of generations required to reach the specified criteria for each value of 'n'.
* **n = 100:** The box plot is centered around approximately 300 generations. The box extends from roughly 200 to 450 generations. A single outlier is present at approximately 550 generations.
* **n = 200:** The box plot is centered around approximately 750 generations. The box extends from roughly 500 to 950 generations.
* **n = 300:** The box plot is centered around approximately 1200 generations. The box extends from roughly 900 to 1500 generations. An outlier is present at approximately 1650 generations.
* **n = 400:** The box plot is centered around approximately 1800 generations. The box extends from roughly 1400 to 2100 generations.
**Trend Verification:** As 'n' increases, the median number of generations required also increases. The interquartile range (IQR) also appears to increase with 'n', indicating greater variability in the number of generations needed.
### Key Observations
* There is a clear positive correlation between 'n' and the number of generations required.
* The variability in the number of generations (as indicated by the box plot size) also increases with 'n'.
* The presence of outliers suggests that, for each value of 'n', there are some runs of the algorithm that require significantly more generations than typical.
### Interpretation
The data suggests that the NSGA-II algorithm's performance on the OneMinMax problem degrades as the parameter 'n' increases. Specifically, it takes more generations, and the time to convergence becomes more variable. This could be due to the increased complexity of the search space as 'n' grows. The outliers indicate that the algorithm can sometimes struggle significantly with certain instances of the problem, even for a fixed value of 'n'. The box plots provide a visual summary of the distribution of performance, allowing for a comparison of the algorithm's robustness across different values of 'n'. The title indicates that the results are for NSGA-II with N=n+1, which is a specific configuration of the algorithm. Further investigation would be needed to understand why the algorithm's performance deteriorates with increasing 'n' and to explore potential strategies for mitigating this effect.