## Line Chart: Accuracy vs. Epochs for Different Methods
### Overview
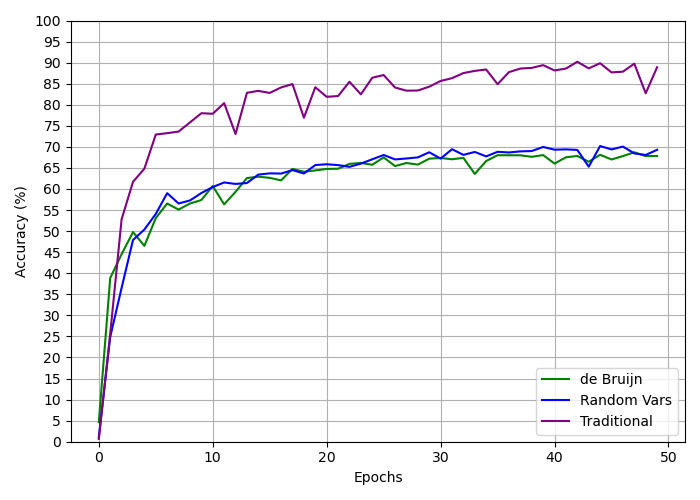
The image is a line chart comparing the accuracy of three different methods ("de Bruijn", "Random Vars", and "Traditional") over 50 epochs. The chart displays accuracy (in percentage) on the y-axis and the number of epochs on the x-axis.
### Components/Axes
* **X-axis:** Epochs, labeled from 0 to 50, with tick marks every 10 epochs.
* **Y-axis:** Accuracy (%), labeled from 0 to 100, with tick marks every 5%.
* **Legend:** Located in the bottom-right corner, it identifies the three methods:
* Green line: "de Bruijn"
* Dark Blue line: "Random Vars"
* Purple line: "Traditional"
### Detailed Analysis
* **de Bruijn (Green):**
* Trend: The accuracy increases rapidly from 0 to approximately 10 epochs, then plateaus with minor fluctuations.
* Data Points:
* Epoch 0: ~5%
* Epoch 5: ~50%
* Epoch 10: ~58%
* Epoch 20: ~64%
* Epoch 30: ~67%
* Epoch 40: ~67%
* Epoch 50: ~68%
* **Random Vars (Dark Blue):**
* Trend: Similar to "de Bruijn," the accuracy increases rapidly initially, then plateaus with minor fluctuations.
* Data Points:
* Epoch 0: ~5%
* Epoch 5: ~58%
* Epoch 10: ~62%
* Epoch 20: ~64%
* Epoch 30: ~69%
* Epoch 40: ~69%
* Epoch 50: ~69%
* **Traditional (Purple):**
* Trend: The accuracy increases rapidly in the beginning, surpasses the other two methods, and then plateaus with some fluctuations.
* Data Points:
* Epoch 0: ~2%
* Epoch 5: ~73%
* Epoch 10: ~78%
* Epoch 20: ~82%
* Epoch 30: ~84%
* Epoch 40: ~89%
* Epoch 50: ~88%
### Key Observations
* The "Traditional" method consistently outperforms the other two methods in terms of accuracy across all epochs.
* Both "de Bruijn" and "Random Vars" methods show similar performance, with "Random Vars" slightly edging out "de Bruijn" after approximately 20 epochs.
* All three methods exhibit a rapid increase in accuracy during the initial epochs, followed by a plateau, indicating diminishing returns with further training.
### Interpretation
The chart demonstrates the performance of three different methods over a series of epochs. The "Traditional" method appears to be the most effective, achieving higher accuracy compared to "de Bruijn" and "Random Vars." The initial rapid increase in accuracy for all methods suggests that the models learn quickly in the early stages of training. The subsequent plateau indicates that further training yields less significant improvements in accuracy. The data suggests that the "Traditional" method may have a better initial configuration or learning algorithm that allows it to achieve higher accuracy levels.