\n
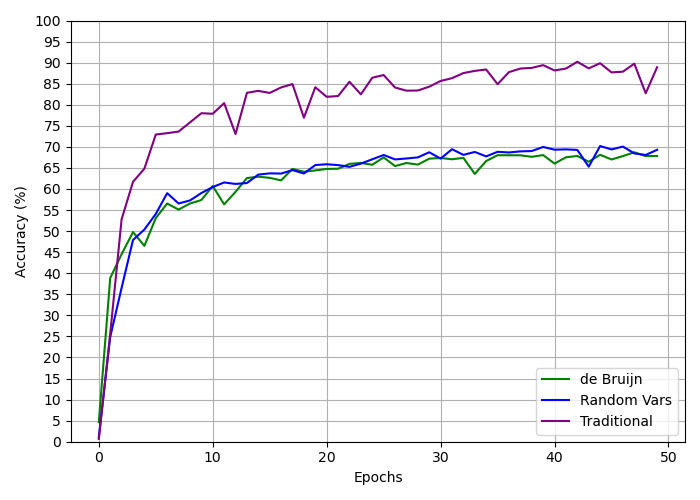
## Line Chart: Accuracy vs. Epochs for Different Methods
### Overview
This image presents a line chart comparing the accuracy of three different methods ("de Bruijn", "Random Vars", and "Traditional") over 50 epochs. The y-axis represents accuracy in percentage, while the x-axis represents the number of epochs. The chart visually demonstrates how the accuracy of each method changes as training progresses.
### Components/Axes
* **X-axis:** "Epochs", ranging from 0 to 50.
* **Y-axis:** "Accuracy (%)", ranging from 0 to 100.
* **Legend:** Located in the bottom-right corner, identifying the three data series:
* "de Bruijn" (Green line)
* "Random Vars" (Blue line)
* "Traditional" (Purple line)
* **Gridlines:** Horizontal and vertical gridlines are present to aid in reading values.
### Detailed Analysis
Let's analyze each line individually, noting trends and approximate data points.
* **de Bruijn (Green Line):** This line starts at approximately 5% accuracy at epoch 0. It exhibits a steep initial increase, reaching around 60% accuracy by epoch 5. The line then plateaus, fluctuating between approximately 63% and 68% accuracy for the remainder of the epochs, ending at approximately 67% at epoch 50.
* **Random Vars (Blue Line):** This line also starts at approximately 5% accuracy at epoch 0. It shows a rapid increase, reaching around 70% accuracy by epoch 5. The line then plateaus, with some fluctuations, between approximately 68% and 72% accuracy for the rest of the epochs, ending at approximately 70% at epoch 50.
* **Traditional (Purple Line):** This line begins at approximately 5% accuracy at epoch 0. It demonstrates the fastest initial increase, reaching around 80% accuracy by epoch 5. The line then plateaus, fluctuating between approximately 80% and 87% accuracy for the remainder of the epochs, ending at approximately 85% at epoch 50. There is a dip around epoch 10, dropping to approximately 78% before recovering.
Here's a table summarizing approximate accuracy values at specific epochs:
| Epoch | de Bruijn (%) | Random Vars (%) | Traditional (%) |
|-------|---------------|-----------------|-----------------|
| 0 | 5 | 5 | 5 |
| 5 | 60 | 70 | 80 |
| 10 | 64 | 70 | 78 |
| 20 | 66 | 71 | 84 |
| 30 | 67 | 70 | 86 |
| 40 | 67 | 70 | 86 |
| 50 | 67 | 70 | 85 |
### Key Observations
* The "Traditional" method consistently achieves the highest accuracy throughout the training process.
* The "Random Vars" method shows a slightly better performance than the "de Bruijn" method.
* All three methods exhibit diminishing returns in accuracy as the number of epochs increases, indicating a plateau in learning.
* The "Traditional" method experiences a temporary dip in accuracy around epoch 10, which is a notable anomaly.
### Interpretation
The chart suggests that the "Traditional" method is the most effective for this particular task, achieving significantly higher accuracy than the "de Bruijn" and "Random Vars" methods. The initial rapid increase in accuracy for all methods indicates that the models are quickly learning from the training data. The plateauing of the accuracy curves suggests that the models have reached their maximum performance level with the given training data and parameters. The dip in accuracy for the "Traditional" method around epoch 10 could be due to a temporary instability in the training process or a challenging batch of training data. Further investigation would be needed to determine the cause of this anomaly. The data demonstrates the importance of method selection in achieving optimal performance in machine learning tasks.