## Diagram: Rule Identification Networks
### Overview
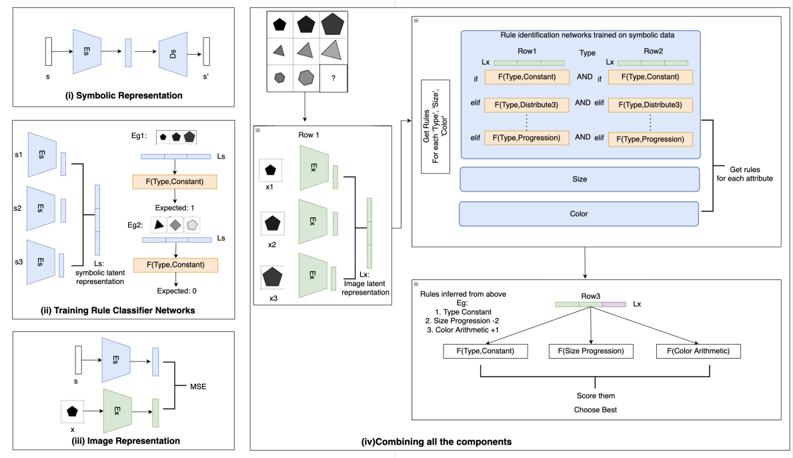
The image presents a diagram illustrating a rule identification network trained on symbolic data. It outlines the process from symbolic representation to combining components for rule inference. The diagram is divided into four sections, each representing a different stage of the process: Symbolic Representation, Training Rule Classifier Networks, Image Representation, and Combining all the components.
### Components/Axes
* **(i) Symbolic Representation:** This section shows a process where an input 's' is encoded and decoded to produce 's''. It involves an encoder (E) and a decoder (D).
* **(ii) Training Rule Classifier Networks:** This section shows three inputs (s1, s2, s3) fed into encoders (E). The outputs are combined to form a symbolic latent representation (Ls). Two examples (Eg1, Eg2) are shown, each with a set of shapes and an expected output (1 and 0, respectively). The function F(Type, Constant) is applied.
* **(iii) Image Representation:** This section shows an input 'x' being encoded by an encoder (E). The output is compared to the symbolic representation 's' using Mean Squared Error (MSE).
* **(iv) Combining all the components:** This section integrates the previous stages to infer rules. It includes a matrix of shapes, rule identification networks, inferred rules, and a scoring mechanism.
### Detailed Analysis
* **Symbolic Representation (i):**
* Input: 's'
* Process: Encoding (E) -> Decoding (D)
* Output: 's''
* **Training Rule Classifier Networks (ii):**
* Inputs: s1, s2, s3
* Process: Encoding (E) -> Symbolic Latent Representation (Ls)
* Examples:
* Eg1: Three shapes (black pentagon, gray pentagon, white pentagon), Expected: 1, F(Type, Constant)
* Eg2: Three shapes (black pentagon, gray triangle, white pentagon), Expected: 0, F(Type, Constant)
* **Image Representation (iii):**
* Input: 'x' (black pentagon)
* Process: Encoding (E)
* Comparison: MSE with 's'
* **Combining all the components (iv):**
* **Top-Left:** A 3x3 grid of shapes, with the bottom-right cell containing a question mark. The shapes are variations of pentagons and triangles in different shades of gray.
* **Left-Center:** "Row 1" with three shapes (x1, x2, x3) each being a black pentagon. Each shape is processed by an encoder (E) to produce an image latent representation (Lx).
* **Top-Right:** "Rule identification networks trained on symbolic data". It has three rows (Row1, Type, Row2) and columns.
* Row 1: Lx, F(Type, Constant), F(Type, Distribute3), F(Type, Progression)
* Row 2: F(Type, Constant), F(Type, Distribute3), F(Type, Progression)
* The text "Get Rules For each 'Type', 'Size', 'Color'" is present.
* There are also boxes labeled "Size" and "Color" with an arrow pointing to "Get rules for each attribute".
* **Bottom-Center:** "Rules inferred from above".
* Eg:
1. Type Constant
2. Size Progression -2
3. Color Arithmetic +1
* "Row3" with three functions: F(Type, Constant), F(Size Progression), F(Color Arithmetic).
* The text "Score them Choose Best" is present.
### Key Observations
* The diagram illustrates a system for learning rules from symbolic and image data.
* The system uses encoders to create latent representations of both symbolic and image data.
* The rule identification networks are trained on symbolic data and used to infer rules based on the latent representations.
* The inferred rules are then used to score and choose the best rule.
### Interpretation
The diagram describes a machine learning system designed to infer rules from visual data by combining symbolic and image-based representations. The system learns to associate visual patterns with symbolic descriptions, allowing it to generalize and make predictions about new data. The use of encoders and latent representations allows the system to capture the essential features of the data while reducing dimensionality. The rule identification networks provide a mechanism for learning and applying rules based on the latent representations. The scoring mechanism allows the system to select the best rule based on its performance. This approach could be used in various applications, such as visual reasoning, pattern recognition, and robotics.