## Diagram: Symbolic and Image Representation System for Rule Classification
### Overview
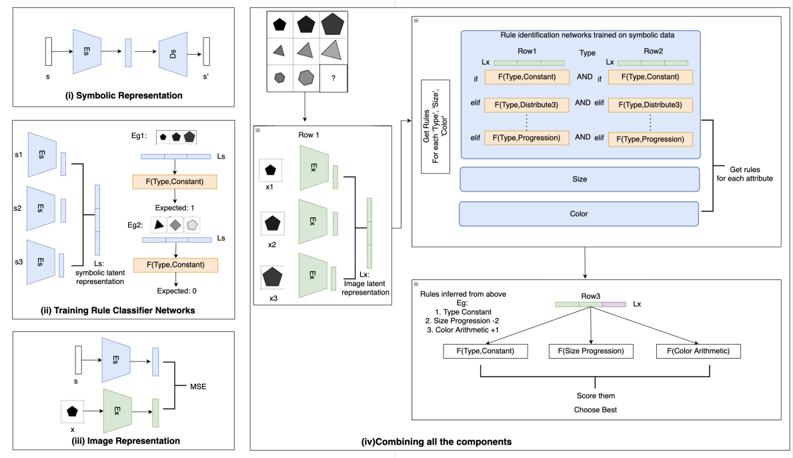
The diagram illustrates a multi-stage system for processing symbolic and image data to classify rules. It combines symbolic representations, rule classifier networks, image representations, and a final rule combination mechanism. Key components include latent representations, rule identification networks, and attribute-based rule scoring.
### Components/Axes
1. **Symbolic Representation (i)**
- Input: `s` (symbolic state)
- Output: `s'` (transformed symbolic state)
- Components: Encoder (`Es`), Decoder (`Ds`)
2. **Training Rule Classifier Networks (ii)**
- **Symbolic Latent Representation**:
- Inputs: `s1`, `s2`, `s3`
- Outputs: Expected values (1 or 0) via `F(Type, Constant)`
- **Image Latent Representation**:
- Input: `x` (image data)
- Output: MSE (Mean Squared Error) metric
3. **Rule Identification Networks (iv)**
- **Attributes**: Size, Color
- **Rules**:
- `F(Type, Constant)`
- `F(Type, Distribution)`
- `F(Type, Progression)`
- `F(Size Progression)`
- `F(Color Arithmetic)`
- **Logic**: AND/IF conditions between rules (e.g., `Row1: F(Type, Constant) AND F(Type, Distribution)`)
4. **Final Rule Combination (iv)**
- **Scoring**: Rules are scored and ranked (e.g., `Row3: F(Type, Constant) + F(Size Progression) + F(Color Arithmetic)`)
- **Output**: Best rule selected
### Detailed Analysis
- **Symbolic Representation**:
- Encoder (`Es`) and Decoder (`Ds`) transform symbolic states (`s` → `s'`).
- No numerical values provided; focus on structural relationships.
- **Training Rule Classifier Networks**:
- Symbolic inputs (`s1`, `s2`, `s3`) are mapped to expected outputs (1 or 0) using `F(Type, Constant)`.
- Image latent representation (`x`) is evaluated via MSE, indicating error measurement.
- **Rule Identification Networks**:
- Rules are combined using logical operators (AND/IF) across attributes (Size, Color).
- Example: `Row1` combines `F(Type, Constant)` and `F(Type, Distribution)`.
- **Final Rule Combination**:
- Rules are scored and ranked (e.g., `Row3` aggregates three rules).
- Final output selects the "Best" rule based on scores.
### Key Observations
- **Hierarchical Structure**: The system progresses from raw symbolic/image data to rule classification and final combination.
- **Attribute Dependency**: Rules are tied to attributes (Size, Color), suggesting attribute-based decision-making.
- **Logical Combination**: AND/IF conditions imply rule interdependencies (e.g., `Row1` requires both `F(Type, Constant)` and `F(Type, Distribution)`).
### Interpretation
This system appears to model a machine learning pipeline for rule classification, integrating symbolic and image data. The use of `F(Type, ...)` functions suggests feature extraction or rule encoding, while MSE quantifies image representation accuracy. The final rule combination step indicates a decision-making process where multiple rules are aggregated and ranked. The absence of numerical values limits quantitative analysis, but the flow emphasizes symbolic-to-rule mapping and attribute-driven rule selection. The system likely addresses tasks requiring both symbolic reasoning (e.g., logic puzzles) and image-based pattern recognition (e.g., object classification).