## Line Graphs: Model Accuracy vs. Dimension Across Sequence Lengths
### Overview
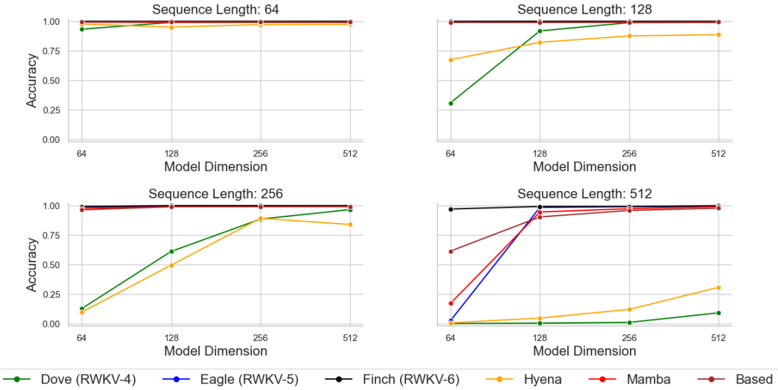
The image contains four line graphs arranged in a 2x2 grid, each representing model accuracy across varying model dimensions (64, 128, 256, 512) for four sequence lengths (64, 128, 256, 512). Models include Dove (RWKV-4), Eagle (RWKV-5), Finch (RWKV-6), Hyena, Mamba, and Based. Accuracy ranges from 0.0 to 1.0 on the y-axis.
---
### Components/Axes
- **X-axis**: Model Dimension (64, 128, 256, 512)
- **Y-axis**: Accuracy (0.0 to 1.0)
- **Legends**:
- Green: Dove (RWKV-4)
- Blue: Eagle (RWKV-5)
- Black: Finch (RWKV-6)
- Yellow: Hyena
- Red: Mamba
- Maroon: Based
---
### Detailed Analysis
#### Sequence Length: 64
- **Trend**: All models show flat lines, indicating minimal accuracy variation with model dimension.
- **Values**:
- Dove: ~0.95–1.0
- Eagle: ~0.95–1.0
- Finch: ~0.95–1.0
- Hyena: ~0.95–1.0
- Mamba: ~0.95–1.0
- Based: ~0.95–1.0
#### Sequence Length: 128
- **Trend**: Most models remain flat, but Dove (green) shows a slight upward slope.
- **Values**:
- Dove: ~0.95–1.0
- Eagle: ~0.95–1.0
- Finch: ~0.95–1.0
- Hyena: ~0.90–0.95
- Mamba: ~0.95–1.0
- Based: ~0.95–1.0
#### Sequence Length: 256
- **Trend**: Significant divergence:
- Dove (green) rises sharply from ~0.25 to ~0.95.
- Eagle (blue) drops from ~0.95 to ~0.5.
- Finch (black) remains flat at ~0.95.
- Hyena (yellow) rises from ~0.25 to ~0.8.
- Mamba (red) stays flat at ~0.95.
- Based (maroon) remains flat at ~0.95.
- **Values**:
- Dove: ~0.25 (64) → ~0.95 (512)
- Eagle: ~0.95 (64) → ~0.5 (512)
- Finch: ~0.95 (all)
- Hyena: ~0.25 (64) → ~0.8 (512)
- Mamba: ~0.95 (all)
- Based: ~0.95 (all)
#### Sequence Length: 512
- **Trend**: Mixed performance:
- Dove (green) peaks at ~0.95 but drops to ~0.25 at 512.
- Eagle (blue) rises from ~0.0 to ~0.95.
- Finch (black) stays flat at ~0.95.
- Hyena (yellow) rises from ~0.0 to ~0.3.
- Mamba (red) peaks at ~0.95 but drops to ~0.8.
- Based (maroon) remains flat at ~0.95.
- **Values**:
- Dove: ~0.95 (128) → ~0.25 (512)
- Eagle: ~0.0 (64) → ~0.95 (512)
- Finch: ~0.95 (all)
- Hyena: ~0.0 (64) → ~0.3 (512)
- Mamba: ~0.95 (256) → ~0.8 (512)
- Based: ~0.95 (all)
---
### Key Observations
1. **Model Robustness**:
- Finch and Based maintain high accuracy across all dimensions and sequence lengths.
- Mamba shows stability until sequence length 512, where accuracy drops.
2. **Dimension Sensitivity**:
- Dove performs poorly at low dimensions (64) but excels at 256, then degrades at 512.
- Eagle improves dramatically at 512 but underperforms at smaller dimensions.
- Hyena shows gradual improvement with dimension but lags behind others.
3. **Sequence Length Impact**:
- Longer sequences (256, 512) reveal greater model variability.
- Models like Eagle and Dove exhibit non-linear scaling behavior.
---
### Interpretation
- **Optimal Dimensions**:
- Finch and Based are dimension-agnostic, suggesting architectural robustness.
- Dove and Hyena require mid-range dimensions (128–256) for peak performance.
- Eagle benefits from larger dimensions (512) but struggles at smaller scales.
- **Sequence Length Trade-offs**:
- Longer sequences amplify model weaknesses (e.g., Eagle’s collapse at 128, Dove’s drop at 512).
- Mamba’s decline at 512 suggests architectural limits for very long sequences.
- **Design Implications**:
- Models like Finch and Based are preferable for variable sequence lengths.
- Dove and Hyena may require careful dimension tuning for specific tasks.
- Eagle’s performance highlights the need for architectural adjustments to handle short sequences.
This analysis underscores the importance of model-architecture alignment with sequence length and computational constraints.