## Composite Image: Mathematical and Algorithmic Problems
### Overview
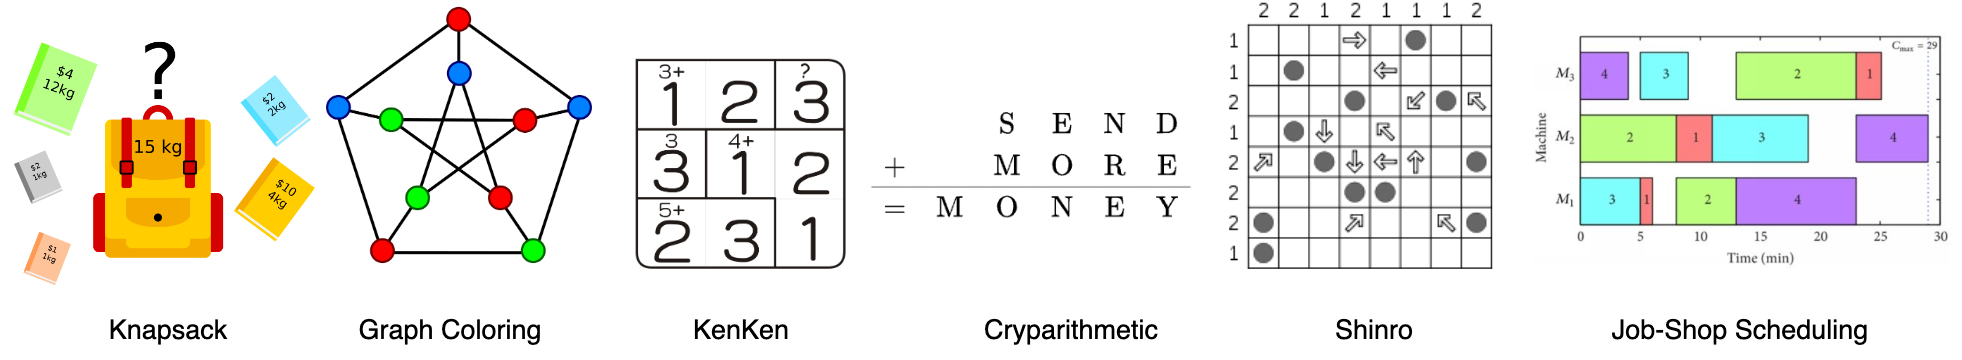
The image presents a collection of different types of mathematical and algorithmic problems. These include a knapsack problem, graph coloring, a KenKen puzzle, a cryptarithmetic problem, a Shinro puzzle, and a job-shop scheduling diagram.
### Components/Axes
* **Knapsack:** An illustration of a knapsack with a capacity of 15 kg, surrounded by items with different weights and values. The items are:
* A green book labeled "$4, 12kg"
* A blue book labeled "$2, 2kg"
* A yellow book labeled "$10, 4kg"
* A peach book labeled "$1, 1kg"
* A grey book labeled "$2, 1kg"
* A question mark above the knapsack indicates the problem is to determine which items to include to maximize value without exceeding the weight limit.
* **Graph Coloring:** A graph with vertices colored red, green, and blue. The graph consists of a pentagon with an inner star.
* **KenKen:** A 3x3 grid with arithmetic constraints. The constraints are:
* Top-left cell: "3+"
* Middle-left cell: "3"
* Bottom-left cell: "5+"
* Top-middle cell: None
* Middle-middle cell: "4+"
* Bottom-middle cell: None
* Top-right cell: "?"
* Middle-right cell: None
* Bottom-right cell: None
The grid contains the numbers 1, 2, and 3.
* **Cryparithmetic:** The equation SEND + MORE = MONEY, where each letter represents a unique digit.
* **Shinro:** A 6x6 grid with numbers 1 and 2 along the top and left edges. The grid contains circles and arrows.
* **Job-Shop Scheduling:** A Gantt chart showing the scheduling of jobs on three machines (M1, M2, M3). The x-axis is labeled "Time (min)" and ranges from 0 to 30. The y-axis represents the machines. The makespan (Cmax) is 29.
### Detailed Analysis
**Knapsack:**
* The problem is to maximize the value of items placed in the knapsack without exceeding its 15 kg capacity.
**Graph Coloring:**
* The graph is a combination of a pentagon and a star.
* The vertices are colored red, green, and blue.
**KenKen:**
* The grid is 3x3.
* The constraints are addition.
* The goal is to fill the grid with numbers 1, 2, and 3 such that each row and column contains each number exactly once, and the numbers in each heavily outlined set of cells combine (in some order) to produce the target number in the top-left corner of the set using the specified mathematical operation.
**Cryparithmetic:**
* The problem is to assign digits to the letters S, E, N, D, M, O, R, Y such that the equation SEND + MORE = MONEY is true.
**Shinro:**
* The grid is 6x6.
* The grid contains circles and arrows.
* The numbers along the top and left edges are 1 and 2.
**Job-Shop Scheduling:**
* Three machines (M1, M2, M3) are scheduling four jobs (1, 2, 3, 4).
* The x-axis represents time in minutes, ranging from 0 to 30.
* The makespan (Cmax) is 29 minutes.
* Machine M1 processes job 3 from 0 to approximately 5 minutes, job 2 from approximately 5 to 10 minutes, job 4 from approximately 10 to 15 minutes, and job 1 from approximately 15 to 20 minutes.
* Machine M2 processes job 1 from 0 to approximately 2 minutes, job 3 from approximately 2 to 10 minutes, job 4 from approximately 10 to 15 minutes, and job 2 from approximately 15 to 25 minutes.
* Machine M3 processes job 4 from 0 to approximately 5 minutes, job 3 from approximately 5 to 15 minutes, job 2 from approximately 15 to 25 minutes, and job 1 from approximately 25 to 29 minutes.
### Key Observations
* The image presents a variety of mathematical and algorithmic problems.
* Each problem has its own unique characteristics and challenges.
* The job-shop scheduling diagram shows the scheduling of jobs on three machines, with a makespan of 29 minutes.
### Interpretation
The image serves as a visual representation of different problem-solving paradigms within mathematics and computer science. The knapsack problem exemplifies optimization, graph coloring demonstrates constraint satisfaction, KenKen combines logic and arithmetic, cryptarithmetic involves pattern recognition and deduction, Shinro tests spatial reasoning, and job-shop scheduling focuses on resource allocation and efficiency. The collection highlights the diverse range of challenges and techniques used in these fields.