## Mixed Problem Set Diagram: Educational Concepts Illustration
### Overview
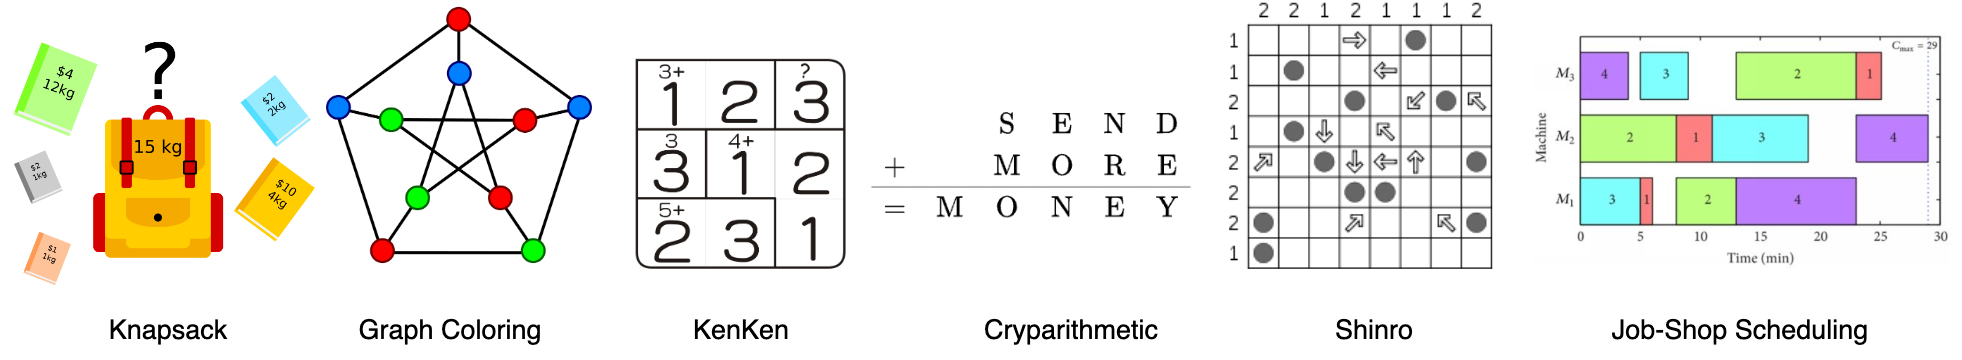
The image presents six distinct educational problem types arranged horizontally, each with unique visual representations and labeled components. The layout combines mathematical puzzles, optimization problems, and scheduling diagrams in a comparative format.
### Components/Axes
1. **Knapsack Problem**
- Visual: Yellow backpack (15kg capacity) with floating items
- Labels:
- Items: $4 (12kg), $2 (2kg), $10 (4kg), $2 (1kg), $1 (1kg)
- Question mark above backpack
2. **Graph Coloring**
- Visual: 10-node graph with colored nodes (red, blue, green)
- Labels: "Graph Coloring" title
- Structure: Nodes connected by black lines forming a star pattern
3. **KenKen Puzzle**
- Visual: 4x4 grid with arithmetic constraints
- Labels:
- Grid values:
```
3+ | 2 | ? | 3
3 | 4+ | 1 | 2
5+ | 2 | 3 | 1
```
- Operations: "+", "=", "MONEY" equation
4. **Cryparithmetic**
- Visual: Letter-based equation
- Labels:
- Equation: SEND + MORE = MONEY
- Letter-to-digit mapping implied
5. **Shinro Puzzle**
- Visual: 5x5 grid with directional arrows and dots
- Labels:
- Grid coordinates: 1-2 rows/columns
- Symbols: Circles (●), arrows (→, ←, ↑, ↓)
6. **Job-Shop Scheduling**
- Visual: Gantt chart with colored time blocks
- Labels:
- Time axis: 0-30 minutes
- Machines: M1-M4 (purple, blue, green, red)
- C_max = 29 (maximum completion time)
### Detailed Analysis
1. **Knapsack Problem**
- Item values/weights:
- High-value/weight: $10 (4kg)
- Low-value/weight: $1 (1kg)
- Capacity constraint: 15kg backpack
2. **Graph Coloring**
- Node distribution:
- Red: 4 nodes
- Blue: 3 nodes
- Green: 3 nodes
- Connectivity: Star-shaped graph with central blue node
3. **KenKen Puzzle**
- Grid constraints:
- Row sums: 3+, 3, 5+, 2
- Column constraints: 2, 4+, 1, 3
- Center cell: 4+ (requires 1+3 or 2+2)
4. **Cryparithmetic**
- Letter-digit relationships:
- S + M = M or M+1 (carryover)
- E appears in SEND and MONEY
- N appears in SEND and MONEY
5. **Shinro Puzzle**
- Movement patterns:
- Arrows indicate directional constraints
- Dots represent valid positions
- Grid coordinates: 1-2 rows/columns with mixed symbols
6. **Job-Shop Scheduling**
- Time distribution:
- Machine M1: 3+4+2 = 9 minutes
- Machine M2: 2+3+4 = 9 minutes
- Machine M3: 4+3+2 = 9 minutes
- Machine M4: 1+1+1 = 3 minutes
- Critical path: M3's 4-minute task at 25-29 minutes
### Key Observations
1. **Resource Constraints**: All problems involve optimization under constraints (weight, colors, arithmetic, time)
2. **Visual Encoding**:
- Color coding used consistently across sections (red/blue/green for graph coloring and scheduling)
- Spatial relationships emphasize problem structure (e.g., graph connections, grid constraints)
3. **Complexity Indicators**:
- KenKen's 4x4 grid vs. Shinro's 5x5 grid
- Job-Shop's 4-machine system vs. Knapsack's single constraint
### Interpretation
This composite diagram serves as an educational taxonomy of problem-solving domains:
1. **Mathematical Optimization**: Knapsack and Graph Coloring represent NP-hard problems
2. **Logical Deduction**: KenKen and Shinro require constraint satisfaction
3. **Operational Research**: Job-Shop Scheduling demonstrates real-world scheduling challenges
4. **Cryptarithmetic** bridges mathematical logic with linguistic patterns
The visual hierarchy suggests a progression from physical constraints (Knapsack) to abstract patterns (Graph Coloring), then to structured puzzles (KenKen/Shinro), culminating in operational systems (Job-Shop). The shared color coding across sections implies intentional cross-problem comparisons, particularly between Graph Coloring and Job-Shop Scheduling's machine assignments.