## Kernel Density Estimation: Cosine Similarity Distribution
### Overview
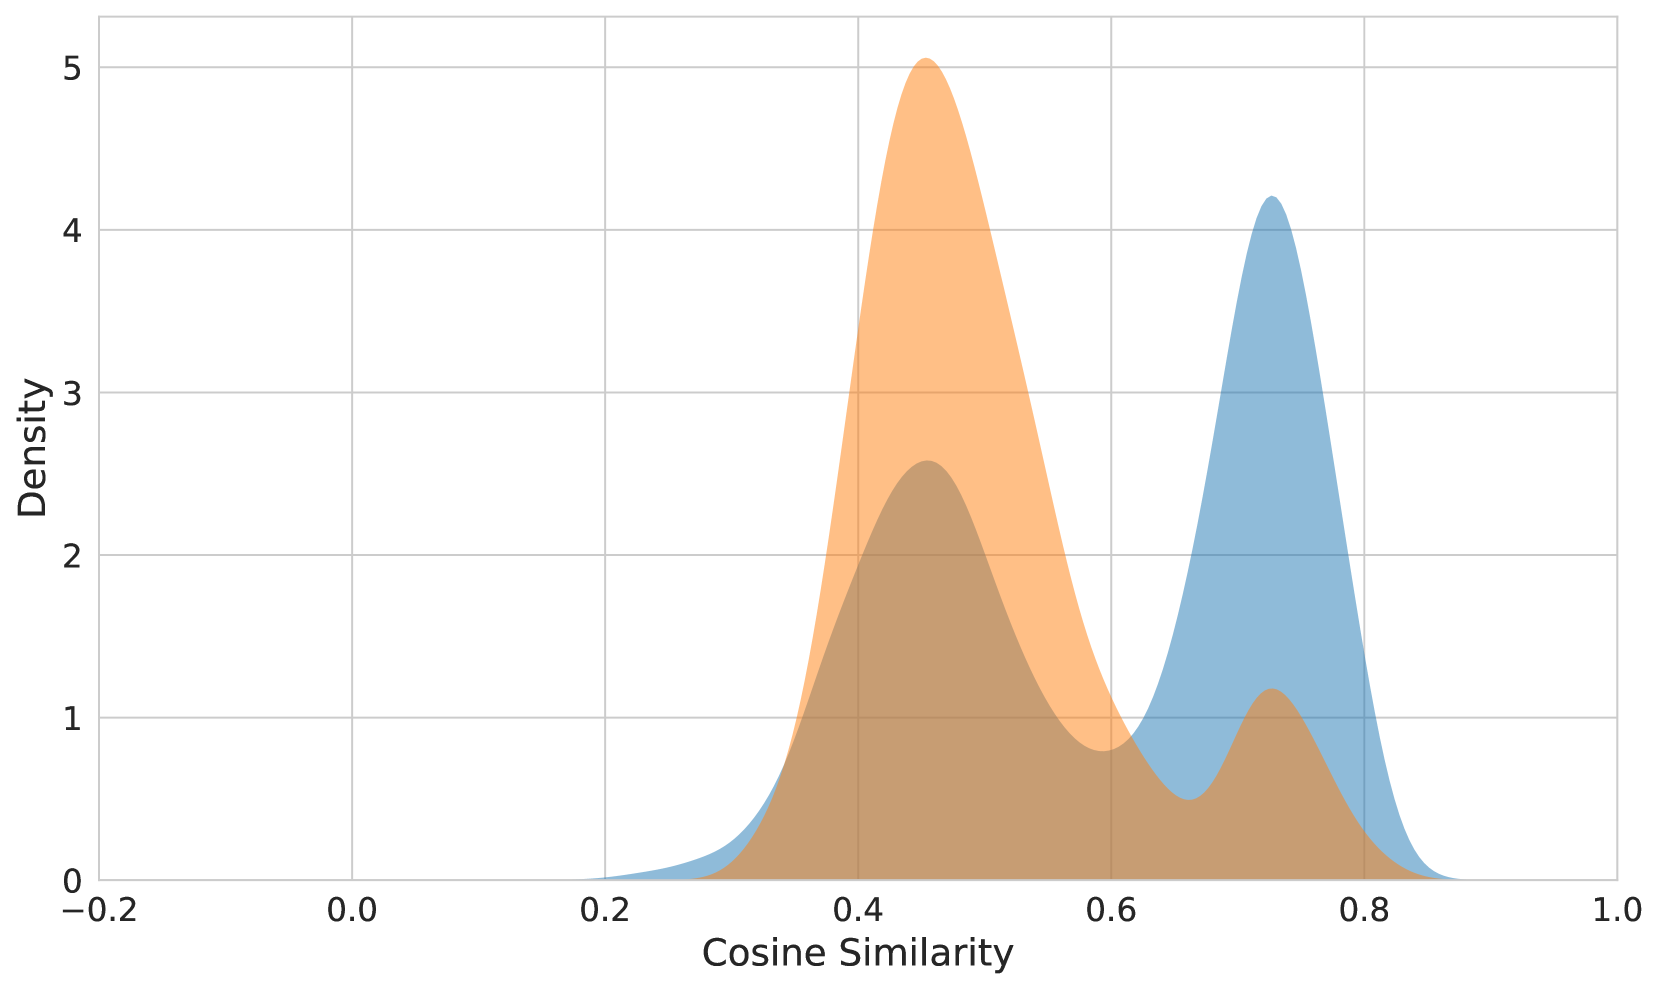
The image displays a Kernel Density Estimation (KDE) plot of the cosine similarity distribution. The KDE is a non-parametric way to estimate the probability density function of a random variable. It is particularly useful for visualizing the distribution of continuous data.
### Components/Axes
- **X-axis**: Labeled "Cosine Similarity," it ranges from -0.2 to 1.0. This axis represents the cosine similarity values, which are a measure of the cosine of the angle between two vectors.
- **Y-axis**: Labeled "Density," it ranges from 0 to 5. This axis represents the density of the cosine similarity values, indicating how frequently each value occurs.
- **Legend**: There is a legend on the right side of the plot, which uses two colors to represent different data series. The legend is not explicitly labeled, but the colors correspond to the two density curves.
### Detailed Analysis or ### Content Details
- **Density Curves**: There are two density curves, one in orange and one in blue. The orange curve is higher and more spread out, indicating a higher density of cosine similarity values around 0.4. The blue curve is lower and more concentrated around 0.6.
- **Trends**: The plot shows that the cosine similarity values are more concentrated around 0.6, with a higher density of values around 0.4. This suggests that cosine similarity values are more likely to be close to 0.6 than to 0.4.
- **Outliers**: There are no visible outliers in the plot, as the density curves are smooth and continuous.
### Key Observations
- The cosine similarity values are more likely to be close to 0.6 than to 0.4.
- The density of values is higher around 0.4 and lower around 0.6.
- There are no visible outliers in the plot.
### Interpretation
The KDE plot suggests that the cosine similarity values are more likely to be close to 0.6 than to 0.4. This could indicate that the cosine similarity metric is more effective at measuring similarity between vectors when the cosine similarity values are closer to 0.6. The higher density around 0.4 could suggest that cosine similarity values are less effective at measuring similarity when the cosine similarity values are closer to 0.4. The absence of outliers suggests that the data is well-behaved and does not contain any extreme values that could skew the results.