\n
## Bar Charts: Brain Alignment Comparison
### Overview
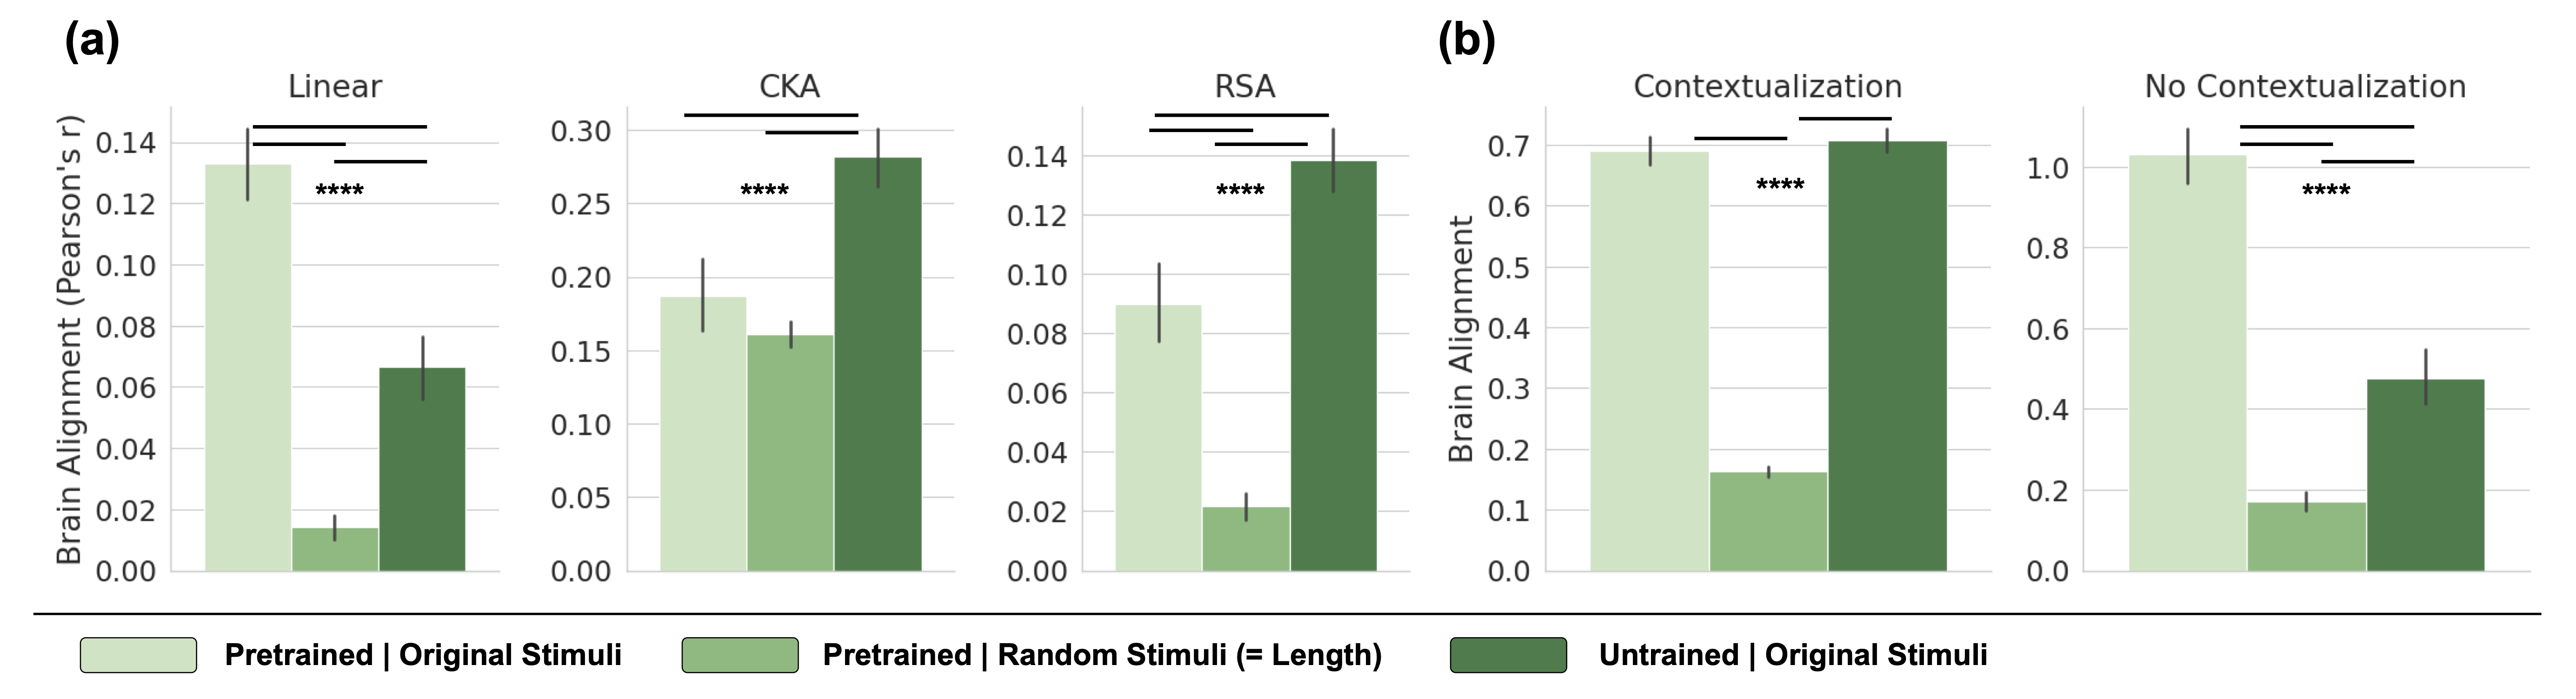
The image presents two sets of bar charts (labeled (a) and (b)) comparing brain alignment scores under different conditions and using different alignment metrics. Chart (a) compares alignment for "Pretrained | Original Stimuli" vs. "Pretrained | Random Stimuli (= Length)" using Linear, CKA, and RSA metrics. Chart (b) compares "Untrained | Original Stimuli" with a baseline. Error bars are present on all bars, and significance is indicated with asterisks.
### Components/Axes
**Chart (a):**
* **X-axis:** Categorical - "Pretrained | Original Stimuli" and "Pretrained | Random Stimuli (= Length)".
* **Y-axis:** "Brain Alignment (Pearson's r)", ranging from 0.00 to 0.30.
* **Metrics (Sub-charts):** Linear, CKA, RSA.
* **Bar Colors:** Light green and dark green.
* **Significance Markers:** Four asterisks (****) above each bar.
**Chart (b):**
* **X-axis:** Categorical - "Untrained | Original Stimuli".
* **Y-axis:** "Brain Alignment", ranging from 0.0 to 1.0.
* **Conditions (Sub-charts):** Contextualization and No Contextualization.
* **Bar Colors:** Light green and dark green.
* **Significance Markers:** Three asterisks (***) above each bar.
### Detailed Analysis or Content Details
**Chart (a):**
* **Linear:**
* "Pretrained | Original Stimuli": Approximately 0.06 ± 0.01 (visually estimated from error bar).
* "Pretrained | Random Stimuli (= Length)": Approximately 0.24 ± 0.02.
* **CKA:**
* "Pretrained | Original Stimuli": Approximately 0.14 ± 0.02.
* "Pretrained | Random Stimuli (= Length)": Approximately 0.26 ± 0.02.
* **RSA:**
* "Pretrained | Original Stimuli": Approximately 0.04 ± 0.01.
* "Pretrained | Random Stimuli (= Length)": Approximately 0.13 ± 0.02.
**Chart (b):**
* **Contextualization:**
* "Untrained | Original Stimuli": Approximately 0.65 ± 0.05.
* **No Contextualization:**
* "Untrained | Original Stimuli": Approximately 0.22 ± 0.04.
### Key Observations
* In Chart (a), for all three metrics (Linear, CKA, RSA), the "Pretrained | Random Stimuli (= Length)" condition consistently shows significantly higher brain alignment scores than the "Pretrained | Original Stimuli" condition.
* In Chart (b), the "Contextualization" condition exhibits a substantially higher brain alignment score compared to the "No Contextualization" condition.
* The error bars suggest relatively low variance within each condition.
* The significance markers (asterisks) indicate that the differences observed in all conditions are statistically significant.
### Interpretation
The data suggests that pretraining on random stimuli (matched in length to original stimuli) leads to higher brain alignment compared to pretraining on original stimuli, as measured by Linear, CKA, and RSA metrics. This could indicate that the model learns representations that are more aligned with brain activity when exposed to random data of similar dimensionality.
Chart (b) demonstrates that contextualization significantly enhances brain alignment. The substantial difference between the "Contextualization" and "No Contextualization" conditions suggests that incorporating contextual information is crucial for aligning model representations with brain activity.
The consistent pattern of higher alignment scores for random stimuli in Chart (a) and the strong effect of contextualization in Chart (b) highlight the importance of both data characteristics and contextual information in building models that better reflect brain processing. The asterisks indicate that these differences are not due to chance. The use of different alignment metrics (Linear, CKA, RSA) in Chart (a) provides robustness to the findings, as the same trend is observed across all metrics.