## Line Graph: Performance Metrics vs. Number of Function Evaluations (NFE)
### Overview
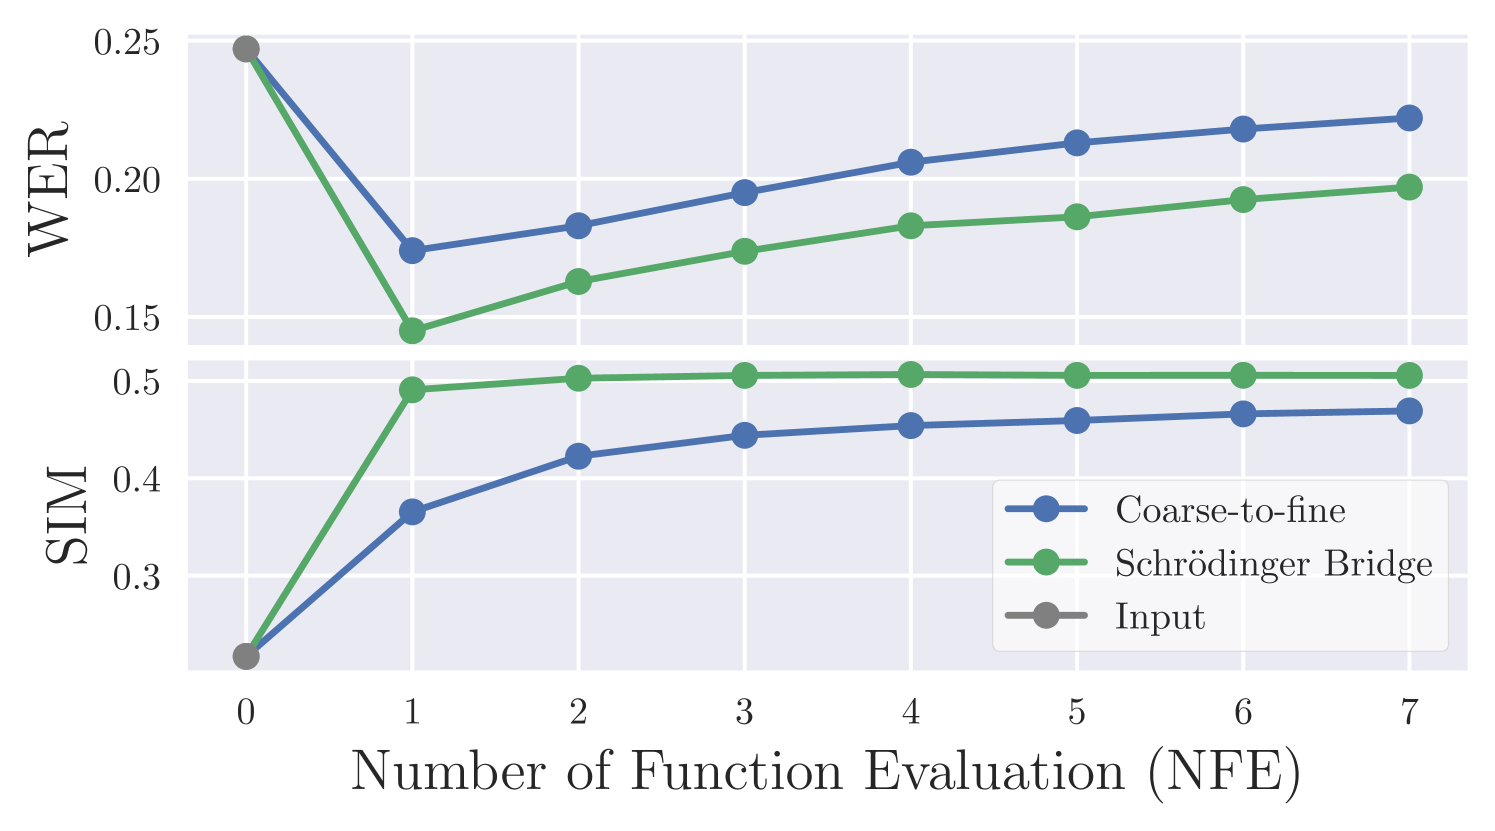
The image is a dual-axis line graph comparing three optimization strategies (Coarse-to-fine, Schrödinger Bridge, Input) across two metrics: Word Error Rate (WER) and Structural Similarity Index (SIM). The x-axis represents the number of Function Evaluations (NFE) from 0 to 7. The graph shows how each strategy's performance evolves with increasing computational effort.
### Components/Axes
- **X-axis**: Number of Function Evaluations (NFE), integer values from 0 to 7.
- **Left Y-axis (WER)**: Word Error Rate, linear scale from 0.15 to 0.25.
- **Right Y-axis (SIM)**: Structural Similarity Index, linear scale from 0.3 to 0.5.
- **Legend**: Located in the bottom-right corner, with three entries:
- **Blue line with circles**: Coarse-to-fine
- **Green line with circles**: Schrödinger Bridge
- **Gray line with diamond**: Input
### Detailed Analysis
#### Coarse-to-fine (Blue)
- **NFE 0**: WER = 0.25, SIM = 0.3
- **NFE 1**: WER ≈ 0.18, SIM ≈ 0.4
- **NFE 2**: WER ≈ 0.19, SIM ≈ 0.42
- **NFE 3**: WER ≈ 0.20, SIM ≈ 0.44
- **NFE 4**: WER ≈ 0.21, SIM ≈ 0.45
- **NFE 5**: WER ≈ 0.22, SIM ≈ 0.46
- **NFE 6**: WER ≈ 0.22, SIM ≈ 0.47
- **NFE 7**: WER ≈ 0.23, SIM ≈ 0.48
#### Schrödinger Bridge (Green)
- **NFE 0**: WER = 0.25, SIM = 0.5
- **NFE 1**: WER ≈ 0.15, SIM ≈ 0.5
- **NFE 2**: WER ≈ 0.17, SIM ≈ 0.5
- **NFE 3**: WER ≈ 0.18, SIM ≈ 0.5
- **NFE 4**: WER ≈ 0.19, SIM ≈ 0.5
- **NFE 5**: WER ≈ 0.19, SIM ≈ 0.5
- **NFE 6**: WER ≈ 0.20, SIM ≈ 0.5
- **NFE 7**: WER ≈ 0.20, SIM ≈ 0.5
#### Input (Gray)
- **NFE 0**: WER = 0.25, SIM = 0.3
- **NFE 1**: WER ≈ 0.15, SIM ≈ 0.5
- **NFE 2–7**: No data points (line remains flat at WER = 0.15, SIM = 0.5)
### Key Observations
1. **Input Strategy**:
- Drops sharply from (WER=0.25, SIM=0.3) at NFE=0 to (WER=0.15, SIM=0.5) at NFE=1.
- Remains constant for NFE ≥ 1, suggesting no further improvement with additional evaluations.
2. **Coarse-to-fine**:
- Initial WER decrease (0.25 → 0.18) followed by gradual WER increase (0.18 → 0.23) as NFE increases.
- SIM improves steadily (0.3 → 0.48) with increasing NFE.
3. **Schrödinger Bridge**:
- WER decreases sharply (0.25 → 0.15) at NFE=1, then plateaus.
- SIM remains constant at 0.5 across all NFE values.
### Interpretation
- **Trade-off Dynamics**:
- Coarse-to-fine shows a trade-off between WER and SIM, with WER increasing as SIM improves at higher NFE.
- Schrödinger Bridge achieves optimal SIM (0.5) immediately but fails to reduce WER further after NFE=1.
- Input strategy demonstrates a one-time "jump" in performance, after which it stagnates, implying limited scalability.
- **Efficiency Insights**:
- Schrödinger Bridge achieves the lowest WER (0.15) with minimal NFE (1), but its WER plateaus.
- Coarse-to-fine requires more NFE to improve SIM but suffers from WER degradation at higher NFE.
- Input's flat performance after NFE=1 suggests it may represent a baseline or non-iterative method.
- **Anomalies**:
- The Input strategy's abrupt drop at NFE=1 contrasts with the gradual changes in other methods.
- Schrödinger Bridge's constant SIM across all NFE values is unusual, indicating potential saturation or a fixed upper bound.
This graph highlights the differing optimization trajectories of the three methods, with Coarse-to-fine showing the most dynamic behavior and Input/Schrödinger Bridge exhibiting early saturation.