## Diagram: AI Application and Evaluation
### Overview
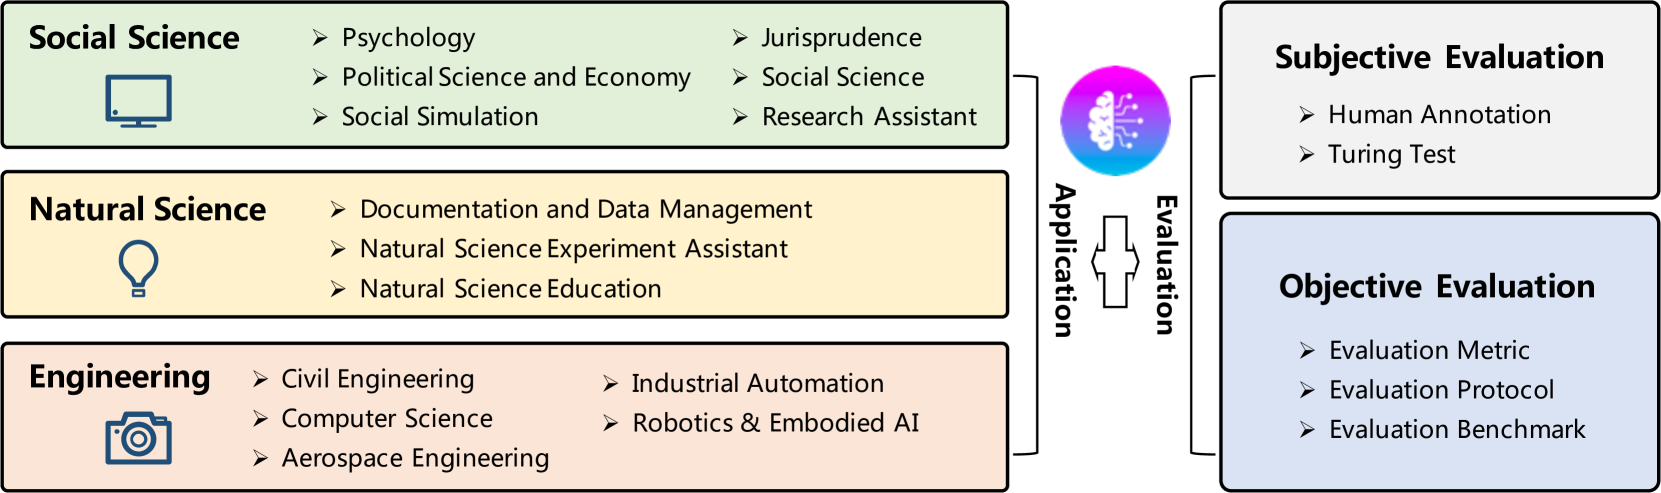
The image is a diagram illustrating the application and evaluation of AI across different scientific disciplines. It shows how AI applications in Social Science, Natural Science, and Engineering are evaluated through both subjective and objective methods.
### Components/Axes
* **Left Side:** Three boxes representing different scientific disciplines:
* Social Science (light green background) with a computer monitor icon.
* Natural Science (light yellow background) with a lightbulb icon.
* Engineering (light orange background) with a camera icon.
* **Center:** A vertical flow diagram showing "Application" and "Evaluation" connected by a double-headed arrow. An AI brain icon is present above the arrow.
* **Right Side:** Two boxes representing evaluation methods:
* Subjective Evaluation (white background).
* Objective Evaluation (light blue background).
### Detailed Analysis
**1. Social Science (Top-Left):**
* Background color: Light green.
* Icon: Computer monitor.
* Sub-categories:
* Psychology
* Political Science and Economy
* Social Simulation
* Jurisprudence
* Social Science
* Research Assistant
**2. Natural Science (Middle-Left):**
* Background color: Light yellow.
* Icon: Lightbulb.
* Sub-categories:
* Documentation and Data Management
* Natural Science Experiment Assistant
* Natural Science Education
**3. Engineering (Bottom-Left):**
* Background color: Light orange.
* Icon: Camera.
* Sub-categories:
* Civil Engineering
* Computer Science
* Aerospace Engineering
* Industrial Automation
* Robotics & Embodied AI
**4. Application and Evaluation (Center):**
* AI Brain Icon: Located at the top, colored with a gradient from pink to blue.
* Application: Text label on the left side of the vertical arrow.
* Evaluation: Text label on the right side of the vertical arrow.
* Arrow: A vertical double-headed arrow connecting "Application" and "Evaluation", indicating a two-way relationship.
**5. Subjective Evaluation (Top-Right):**
* Background color: White.
* Sub-categories:
* Human Annotation
* Turing Test
**6. Objective Evaluation (Bottom-Right):**
* Background color: Light blue.
* Sub-categories:
* Evaluation Metric
* Evaluation Protocol
* Evaluation Benchmark
### Key Observations
* The diagram illustrates a process where AI is applied within different scientific disciplines and then evaluated using both subjective and objective methods.
* The double-headed arrow between "Application" and "Evaluation" suggests a feedback loop, where evaluation results can influence future applications.
* The AI brain icon visually represents the core subject of the diagram.
### Interpretation
The diagram presents a high-level overview of how AI is integrated into various scientific fields and how its performance is assessed. It highlights the importance of both subjective and objective evaluation methods in determining the effectiveness and reliability of AI applications. The feedback loop between application and evaluation suggests a continuous improvement process, where insights gained from evaluation are used to refine and enhance AI applications in different domains. The diagram emphasizes the interdisciplinary nature of AI and its relevance across diverse scientific disciplines.