## Diagram: AI Application Domains and Evaluation Framework
### Overview
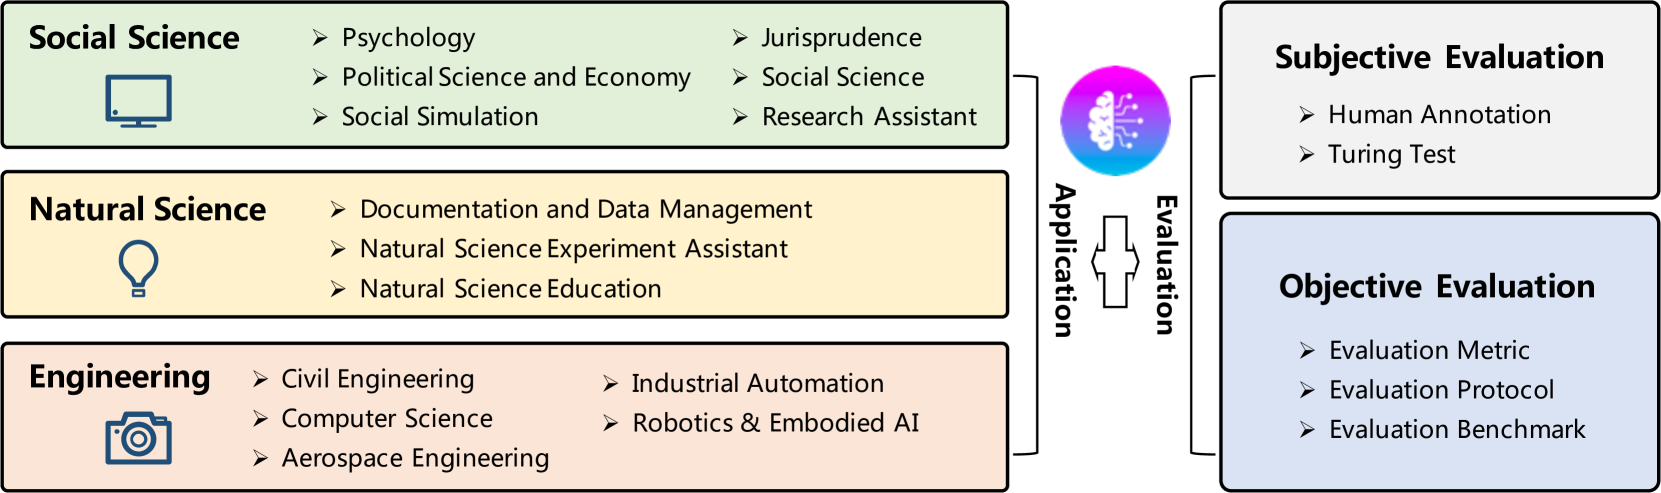
This diagram illustrates a conceptual framework for AI research, mapping specific application domains (left) to their corresponding evaluation methodologies (right), mediated by an AI-driven process (center). The diagram is structured as a flow: Application Domains $\rightarrow$ AI Processing $\rightarrow$ Evaluation.
### Components/Axes
The diagram is organized into three distinct vertical regions:
* **Left Region (Application Domains):** Three horizontal, color-coded rectangular blocks representing scientific and engineering fields.
* **Center Region (Process Mediator):** A circular icon representing AI, with vertical arrows and labels indicating the bidirectional relationship between application and evaluation.
* **Right Region (Evaluation Methods):** Two stacked rectangular blocks representing the methods used to assess AI performance.
### Detailed Analysis
#### 1. Left Region: Application Domains
This section lists specific fields where AI is applied.
* **Social Science (Green Background):**
* Psychology
* Political Science and Economy
* Social Simulation
* Jurisprudence
* Social Science (Note: This is listed as a sub-item within the Social Science category)
* Research Assistant
* *Icon:* A computer monitor.
* **Natural Science (Tan/Yellow Background):**
* Documentation and Data Management
* Natural Science Experiment Assistant
* Natural Science Education
* *Icon:* A lightbulb.
* **Engineering (Peach/Pink Background):**
* Civil Engineering
* Computer Science
* Aerospace Engineering
* Industrial Automation
* Robotics & Embodied AI
* *Icon:* A camera.
#### 2. Center Region: Process Mediator
* **Icon:** A circular graphic featuring a stylized brain with neural network nodes, transitioning in color from pink/purple (top) to blue (bottom).
* **Flow Indicators:** A vertical arrow pointing both up and down is positioned below the brain icon.
* **Application:** Text located to the left of the arrow, indicating the direction of AI deployment into the domains.
* **Evaluation:** Text located to the right of the arrow, indicating the direction of feedback/assessment from the evaluation methods.
#### 3. Right Region: Evaluation Methods
This section lists the methodologies used to validate AI performance.
* **Subjective Evaluation (White Background):**
* Human Annotation
* Turing Test
* **Objective Evaluation (Light Blue Background):**
* Evaluation Metric
* Evaluation Protocol
* Evaluation Benchmark
### Key Observations
* **Categorization:** The diagram creates a clear taxonomy, separating "hard" sciences (Natural Science, Engineering) from "soft" sciences (Social Science).
* **Evaluation Dichotomy:** The right side explicitly separates evaluation into "Subjective" (human-dependent) and "Objective" (system/metric-dependent) categories.
* **Redundancy:** The term "Social Science" appears both as the primary category header and as a specific sub-item within that category.
* **Centrality of AI:** The brain icon acts as the nexus, implying that AI is the common denominator across all listed domains and evaluation types.
### Interpretation
This diagram serves as a high-level taxonomy for an AI research paper or technical proposal. It demonstrates that the authors view AI not as a monolithic tool, but as a versatile technology that must be evaluated differently depending on the domain.
* **The "Application" vs. "Evaluation" Flow:** The bidirectional arrows suggest a feedback loop. AI is applied to a domain, and the results are then subjected to evaluation. The evaluation results likely inform further iterations of the AI application.
* **Methodological Rigor:** By separating Subjective and Objective evaluation, the diagram acknowledges that some domains (like Social Science) may require human-centric validation (Turing Test, Human Annotation), whereas others (like Engineering or Natural Science) may rely more heavily on quantitative metrics and benchmarks.
* **Scope:** The inclusion of "Robotics & Embodied AI" alongside "Social Simulation" indicates a broad scope, covering both physical-world applications and digital/theoretical modeling.