\n
## Diagram: AI Application Areas and Evaluation Methods
### Overview
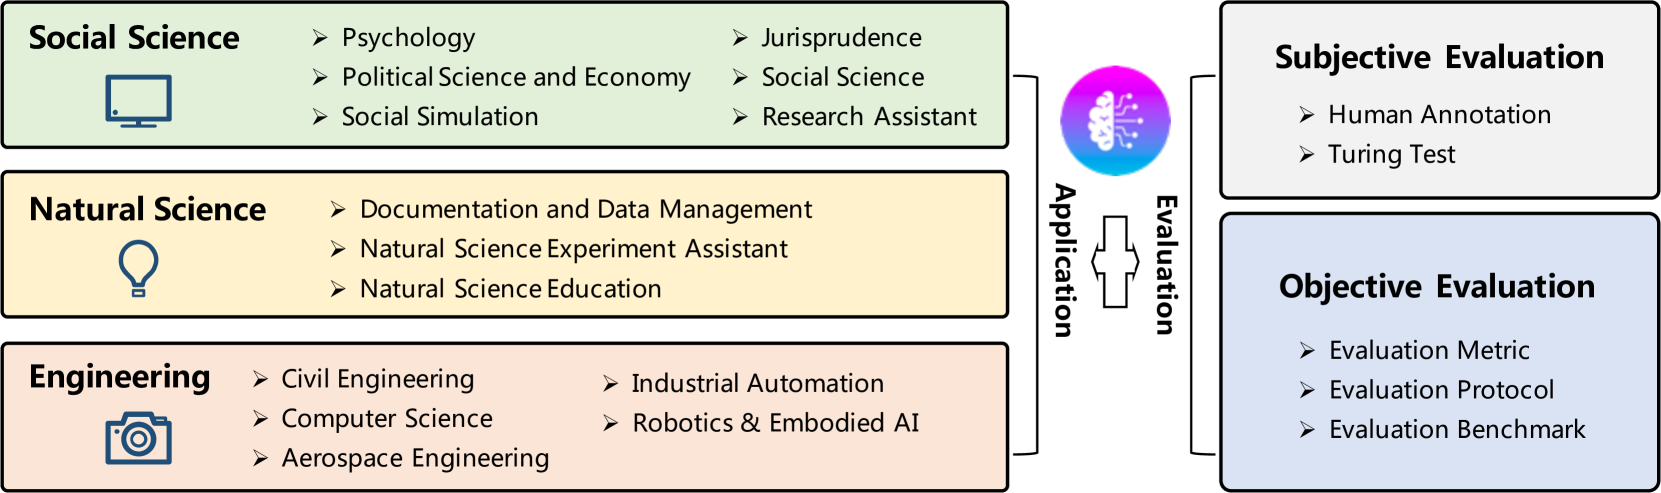
The image is a diagram illustrating the application areas of Artificial Intelligence (AI) across three major disciplines – Social Science, Natural Science, and Engineering – and the methods used for evaluating these applications, categorized as Subjective and Objective Evaluation. The diagram uses icons to represent each discipline and arrows to indicate the flow from application to evaluation.
### Components/Axes
The diagram is structured into two main sections: Application Areas (left) and Evaluation Methods (right). A central arrow labeled "Application" connects these sections.
**Application Areas:**
* **Social Science:** Represented by a laptop icon. Subcategories include:
* Psychology
* Political Science and Economy
* Social Simulation
* Jurisprudence
* Social Science
* Research Assistant
* **Natural Science:** Represented by a lightbulb icon. Subcategories include:
* Documentation and Data Management
* Natural Science Experiment Assistant
* Natural Science Education
* **Engineering:** Represented by a camera icon. Subcategories include:
* Civil Engineering
* Computer Science
* Aerospace Engineering
* Industrial Automation
* Robotics & Embodied AI
**Evaluation Methods:**
* **Subjective Evaluation:** Represented by a brain icon. Subcategories include:
* Human Annotation
* Turing Test
* **Objective Evaluation:** Represented by a bar graph icon. Subcategories include:
* Evaluation Metric
* Evaluation Protocol
* Evaluation Benchmark
### Detailed Analysis or Content Details
The diagram presents a hierarchical structure within each category. The "Application" arrow indicates a process flow from the application areas to the evaluation methods. There are no numerical values or quantitative data presented in the diagram. It is a conceptual representation of relationships between disciplines and evaluation techniques.
### Key Observations
The diagram highlights the broad applicability of AI across diverse fields. It also emphasizes the importance of both subjective (human-centered) and objective (metric-based) evaluation methods. The use of icons provides a quick visual association between the discipline and its representative symbol.
### Interpretation
The diagram suggests a workflow where AI applications are developed within specific disciplines (Social Science, Natural Science, Engineering) and then assessed using a combination of subjective and objective evaluation techniques. The separation into subjective and objective evaluation implies that AI performance can be assessed from both a human perspective (e.g., usability, naturalness) and a quantifiable perspective (e.g., accuracy, efficiency). The diagram doesn't provide specific details about *how* these evaluations are conducted, but it establishes a framework for considering the full lifecycle of AI development and deployment. The diagram is a high-level overview and doesn't delve into the specifics of AI algorithms or methodologies used within each application area. It serves as a conceptual map rather than a detailed technical specification.