## Diagram: AI Application Domains and Evaluation Framework
### Overview
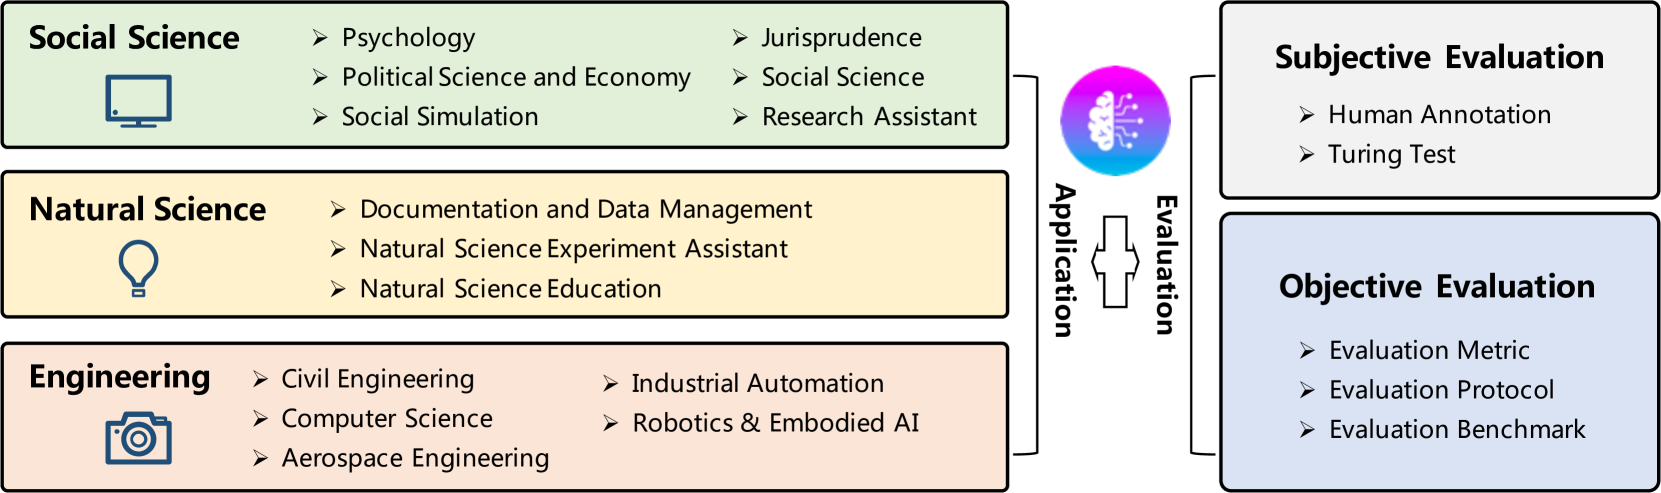
The image is a conceptual diagram illustrating the classification of Artificial Intelligence (AI) applications across three major scientific and engineering domains, and the corresponding methods for their evaluation. The diagram is structured with application domains on the left, evaluation methodologies on the right, and a central connecting element representing the AI system or process.
### Components/Axes
The diagram is organized into three main sections:
1. **Left Column (Application Domains):** Three colored boxes, each representing a broad field of application.
* **Top Box (Light Green):** Labeled **"Social Science"**. Contains an icon of a computer monitor. Lists sub-domains.
* **Middle Box (Light Yellow):** Labeled **"Natural Science"**. Contains an icon of a lightbulb. Lists sub-domains.
* **Bottom Box (Light Pink):** Labeled **"Engineering"**. Contains an icon of a camera. Lists sub-domains.
2. **Right Column (Evaluation Methods):** Two boxes representing evaluation approaches.
* **Top Box (Light Gray):** Labeled **"Subjective Evaluation"**. Lists methods.
* **Bottom Box (Light Blue):** Labeled **"Objective Evaluation"**. Lists methods.
3. **Central Connecting Element:** A circular icon depicting a stylized brain with circuit patterns, colored in a gradient from purple to blue. It is flanked by two vertical text labels:
* Left side (vertical text): **"Application"**
* Right side (vertical text): **"Evaluation"**
A plus sign (`+`) is positioned between these two labels, indicating the combination or interaction of application and evaluation.
### Detailed Analysis
**Left Column - Application Domains:**
* **Social Science Box:**
* Sub-categories listed (with bullet points `➢`):
* Psychology
* Political Science and Economy
* Social Simulation
* Jurisprudence
* Social Science
* Research Assistant
* **Natural Science Box:**
* Sub-categories listed:
* Documentation and Data Management
* Natural Science Experiment Assistant
* Natural Science Education
* **Engineering Box:**
* Sub-categories listed:
* Civil Engineering
* Computer Science
* Aerospace Engineering
* Industrial Automation
* Robotics & Embodied AI
**Right Column - Evaluation Methods:**
* **Subjective Evaluation Box:**
* Methods listed:
* Human Annotation
* Turing Test
* **Objective Evaluation Box:**
* Methods listed:
* Evaluation Metric
* Evaluation Protocol
* Evaluation Benchmark
### Key Observations
1. **Hierarchical Structure:** The diagram presents a clear two-level hierarchy: broad domains (Social Science, Natural Science, Engineering) and specific application areas within them.
2. **Evaluation Dichotomy:** Evaluation is explicitly split into two fundamental categories: **Subjective** (relying on human judgment) and **Objective** (relying on defined metrics and protocols).
3. **Central Role of AI:** The brain/circuit icon at the center, labeled with "Application" and "Evaluation," signifies that AI is the core technology enabling these applications and is itself the subject of these evaluation methods.
4. **Iconography:** Each domain box uses a simple, representative icon (monitor for social science, lightbulb for natural science, camera for engineering) to visually reinforce the category.
5. **Text Orientation:** The labels "Application" and "Evaluation" are written vertically, emphasizing their role as connecting pillars between the left and right sides of the diagram.
### Interpretation
This diagram outlines a framework for understanding the scope and assessment of AI systems. It suggests that AI is not a monolithic tool but is applied in diverse, domain-specific ways across the social sciences, natural sciences, and engineering. The framework argues that evaluating these AI applications requires a dual approach:
* **Subjective Evaluation** captures aspects of performance that are qualitative, context-dependent, and tied to human perception (e.g., is the output helpful, believable, or ethical?).
* **Objective Evaluation** captures aspects that are quantitative, reproducible, and tied to measurable performance against standards (e.g., accuracy, speed, benchmark scores).
The central placement of the AI icon implies that the development and deployment of an AI system inherently involve both applying it to a domain-specific task and subjecting it to appropriate evaluation. The diagram serves as a high-level taxonomy for researchers and practitioners to categorize AI work and consider the necessary evaluation strategies for a given application. The inclusion of "Research Assistant" under Social Science and "Experiment Assistant" under Natural Science highlights a key trend: AI as a tool to augment and accelerate human scientific inquiry.