## Diagram: Directed Graphs Representing Relationships
### Overview
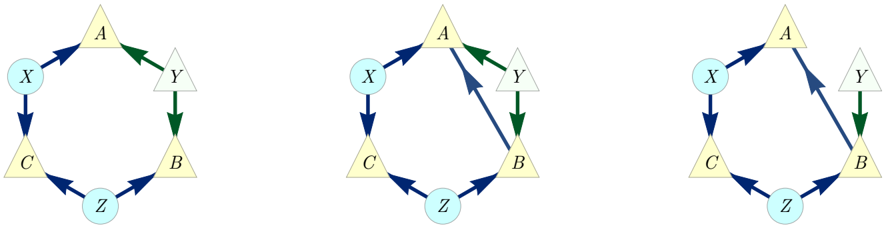
The image displays three distinct directed graphs, each arranged in a circular or near-circular fashion. These graphs consist of nodes represented by circles and triangles, with directed edges (arrows) indicating relationships or flows between them. The nodes are labeled with letters A, B, C, X, Y, and Z. The arrows are predominantly dark blue, with some exceptions of dark green arrows.
### Components/Axes
* **Nodes:**
* **Triangles:** Labeled A, B, Y. These are colored light yellow, except for Y which is light green.
* **Circles:** Labeled X, C, Z. These are colored light blue.
* **Edges:**
* **Dark Blue Arrows:** Represent directed relationships.
* **Dark Green Arrows:** Represent directed relationships, appearing in specific instances.
### Detailed Analysis
The three diagrams are presented side-by-side, allowing for comparison of their structures.
**Diagram 1 (Leftmost):**
* **Nodes:** A (yellow triangle), B (yellow triangle), C (light blue circle), X (light blue circle), Y (green triangle), Z (light blue circle).
* **Edges:**
* X -> A (dark blue arrow)
* X -> C (dark blue arrow)
* C -> Z (dark blue arrow)
* Z -> B (dark blue arrow)
* Y -> B (dark green arrow)
* Y -> A (dark green arrow)
**Diagram 2 (Center):**
* **Nodes:** A (yellow triangle), B (yellow triangle), C (light blue circle), X (light blue circle), Y (green triangle), Z (light blue circle).
* **Edges:**
* X -> A (dark blue arrow)
* X -> C (dark blue arrow)
* C -> Z (dark blue arrow)
* Z -> B (dark blue arrow)
* A -> B (dark blue arrow)
* Y -> B (dark green arrow)
* Y -> A (dark green arrow)
**Diagram 3 (Rightmost):**
* **Nodes:** A (yellow triangle), B (yellow triangle), C (light blue circle), X (light blue circle), Y (green triangle), Z (light blue circle).
* **Edges:**
* X -> A (dark blue arrow)
* X -> C (dark blue arrow)
* C -> Z (dark blue arrow)
* Z -> B (dark blue arrow)
* A -> B (dark blue arrow)
* Y -> B (dark green arrow)
### Key Observations
* **Consistent Elements:** The nodes X, C, and Z are consistently represented as light blue circles, and A and B as yellow triangles. The node Y is consistently a green triangle.
* **Common Structure:** All three diagrams share a common set of dark blue directed edges: X -> A, X -> C, C -> Z, and Z -> B.
* **Divergence:** The primary difference lies in the presence and direction of an edge between A and B.
* Diagram 1 has no direct edge between A and B.
* Diagram 2 has a dark blue arrow from A to B (A -> B).
* Diagram 3 also has a dark blue arrow from A to B (A -> B).
* **Green Arrows:** The dark green arrows from Y to B and Y to A are present in all three diagrams, indicating a consistent relationship originating from Y.
### Interpretation
These diagrams likely represent different states or models of a system with interconnected components. The nodes (A, B, C, X, Y, Z) could represent entities, variables, or states within this system. The directed edges signify influence, causality, or flow between these components.
The consistent dark blue arrows suggest a foundational set of relationships that are present across all scenarios depicted. The variation in the A-B connection between Diagram 1 and Diagrams 2/3 is significant. It implies that in the first scenario, A and B are not directly linked, while in the other two, A exerts a direct influence on B. The green arrows from Y to A and Y to B indicate that Y has a consistent influence on both A and B, regardless of the A-B relationship.
Without further context, it is difficult to definitively state what these systems represent. However, they could be illustrating:
* **Causal Networks:** Where arrows represent causal links.
* **State Transitions:** Where nodes are states and arrows are transitions.
* **Information Flow:** Where arrows represent the direction of information.
* **Dependency Graphs:** Where arrows indicate dependencies.
The presence of two distinct configurations (Diagram 1 vs. Diagrams 2/3) suggests a comparison between two different system dynamics or conditions. The green arrows from Y might represent an external factor or a common input affecting both A and B. The difference between Diagram 2 and Diagram 3 is not visually apparent based on the provided image; they appear identical in terms of node and edge structure. If they are intended to be different, the distinction is not captured by the visual representation.