\n
## Diagram: State Transition Diagrams
### Overview
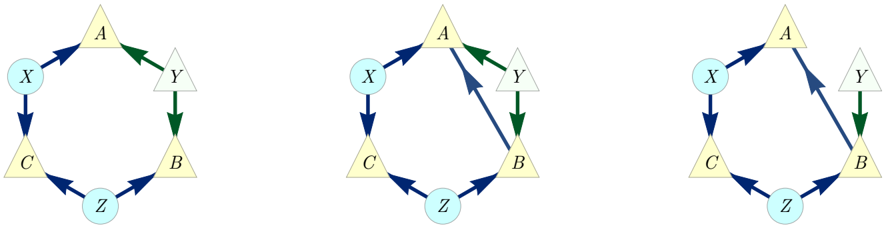
The image presents three separate state transition diagrams. Each diagram depicts a circular arrangement of nodes (X, C, Z, B, Y, A) connected by directed arrows, representing transitions between states. The diagrams differ in the direction of some of these arrows, indicating variations in the possible state transitions.
### Components/Axes
Each diagram consists of:
* **Nodes:** Six nodes labeled X, C, Z, B, Y, and A. These are represented as light yellow triangles (A, B, Y) and light blue circles (X, C, Z).
* **Arrows:** Directed arrows indicating transitions between nodes. Arrows are either dark blue or dark green.
### Detailed Analysis / Content Details
**Diagram 1 (Leftmost):**
* X -> C (Dark Blue)
* C -> Z (Dark Blue)
* Z -> B (Dark Blue)
* B -> Y (Dark Blue)
* Y -> A (Dark Green)
* A -> X (Dark Blue)
**Diagram 2 (Center):**
* X -> C (Dark Blue)
* C -> Z (Dark Blue)
* Z -> B (Dark Blue)
* B -> Y (Dark Green)
* Y -> A (Dark Blue)
* A -> X (Dark Blue)
**Diagram 3 (Rightmost):**
* X -> C (Dark Blue)
* C -> Z (Dark Blue)
* Z -> B (Dark Green)
* B -> Y (Dark Blue)
* Y -> A (Dark Blue)
* A -> X (Dark Blue)
### Key Observations
The primary difference between the diagrams lies in the color of the arrows connecting B to Y, and Z to B. Diagram 1 has a green arrow from Y to A, Diagram 2 has a green arrow from B to Y, and Diagram 3 has a green arrow from Z to B. All other transitions are consistent across the three diagrams. The diagrams all form a closed loop, suggesting a cyclical process.
### Interpretation
These diagrams likely represent different possible states and transitions within a system. The variations in the green arrows suggest alternative pathways or conditions that can influence the system's behavior. The cyclical nature of the diagrams implies that the system can return to its initial state after a series of transitions.
The diagrams could represent:
* **Finite State Machines:** Each node represents a state, and the arrows represent transitions triggered by specific events.
* **Workflow Processes:** Each node represents a step in a process, and the arrows represent the flow of work.
* **Control Systems:** Each node represents a system component, and the arrows represent control signals.
The specific meaning of the nodes and arrows would depend on the context in which these diagrams are used. The differences between the diagrams suggest that the system's behavior can vary depending on certain conditions or inputs. The green arrows likely represent less common or conditional transitions.