## Network Diagram: Three Variations of a Directed Graph
### Overview
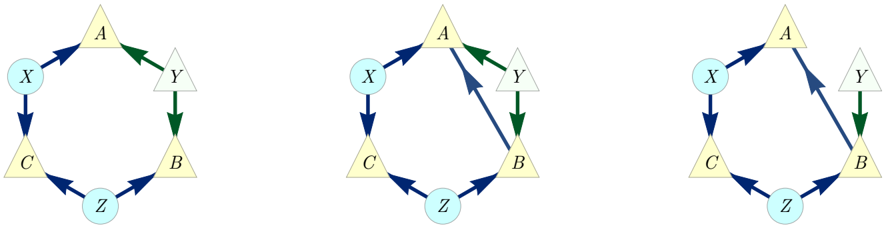
The image displays three separate but related directed graph diagrams arranged horizontally in a single row. Each diagram depicts a network of six nodes (labeled A, B, C, X, Y, Z) connected by directed edges (arrows). The diagrams appear to show variations or states of the same underlying network structure, differing primarily in the presence or absence of specific connections. The nodes are consistently shaped and colored across all three diagrams: nodes A, B, and C are light yellow triangles; nodes X, Y, and Z are light cyan circles.
### Components/Axes
* **Nodes:**
* **A:** Light yellow triangle, positioned at the top center of each diagram.
* **B:** Light yellow triangle, positioned at the bottom right.
* **C:** Light yellow triangle, positioned at the bottom left.
* **X:** Light cyan circle, positioned at the middle left.
* **Y:** Light cyan circle, positioned at the middle right.
* **Z:** Light cyan circle, positioned at the bottom center.
* **Edges (Arrows):** Directed connections between nodes. Two distinct colors are used:
* **Dark Blue Arrows:** Originate from nodes X and Z.
* **Green Arrows:** Originate from node Y.
* **Layout:** The three diagrams are presented side-by-side for comparison. There is no overarching title, axis, or legend provided within the image itself.
### Detailed Analysis
The analysis is segmented by diagram position (Left, Center, Right).
**1. Left Diagram:**
* **Connections from X (Dark Blue):** X → A, X → C.
* **Connections from Y (Green):** Y → A, Y → B.
* **Connections from Z (Dark Blue):** Z → C, Z → B.
* **Notable Absence:** There is no direct connection between nodes B and A.
**2. Center Diagram:**
* **Connections from X (Dark Blue):** X → A, X → C.
* **Connections from Y (Green):** Y → A, Y → B.
* **Connections from Z (Dark Blue):** Z → C, Z → B.
* **Additional Connection:** A dark blue arrow from B → A is present. This is the only difference from the Left Diagram.
**3. Right Diagram:**
* **Connections from X (Dark Blue):** X → A, X → C.
* **Connections from Y (Green):** Y → B. **The connection Y → A is absent.**
* **Connections from Z (Dark Blue):** Z → C, Z → B.
* **Additional Connection:** A dark blue arrow from B → A is present (same as Center Diagram).
### Key Observations
1. **Consistent Core Structure:** All three diagrams share a common base: X connects to A and C; Z connects to C and B; Y connects to B.
2. **Variable Connections:** The key differences lie in two specific edges:
* The edge **Y → A** (green) is present in the Left and Center diagrams but absent in the Right diagram.
* The edge **B → A** (dark blue) is absent in the Left diagram but present in the Center and Right diagrams.
3. **Color-Coding Logic:** The color of an arrow is determined by its source node: all edges originating from X or Z are dark blue; all edges originating from Y are green. This rule holds true across all diagrams.
4. **Spatial Consistency:** The physical layout and positioning of all nodes are identical in all three diagrams, facilitating direct visual comparison of the connection patterns.
### Interpretation
This image presents three states or configurations of a directed network. The diagrams likely illustrate a logical sequence, different rule sets, or the effect of an operation on the network's connectivity.
* **Left Diagram** shows a state where node A receives input only from X and Y. Node B receives input from Y and Z.
* **Center Diagram** introduces a feedback or hierarchical link from B to A. This creates a path where influence from Z (via B) can now reach A, and also creates a cycle between A and B if other paths exist.
* **Right Diagram** modifies the state further by removing the direct input from Y to A. In this configuration, node A's inputs are solely from X and B. This could represent a scenario where Y's influence on A is blocked or rerouted, or where A's dependency shifts entirely to the X and B pathways.
The progression from Left to Right could demonstrate concepts such as:
* **Network Rewiring:** How connections are added or removed to change system behavior.
* **Fault Tolerance:** Showing alternative pathways (e.g., after Y→A fails, B→A provides an alternate route to A).
* **Logical States:** Representing different conditions in a state machine or workflow, where the presence/absence of specific edges defines the state.
The consistent color-coding emphasizes the origin of influence (X/Z vs. Y), making it easy to track how the roles of these source nodes change across the three configurations. The absence of numerical data indicates the diagram's purpose is to convey topological relationships and structural changes rather than quantitative metrics.