## Diagram: Node-Based Flow Structures (A, B, C)
### Overview
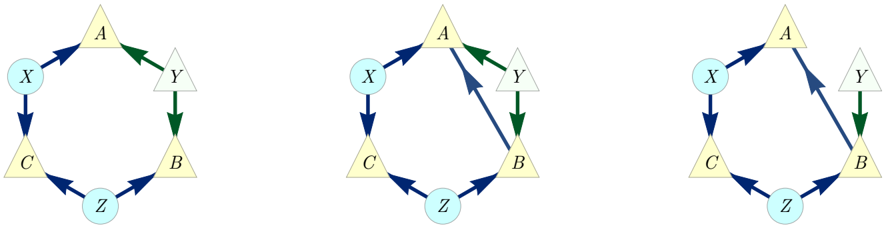
The image presents three distinct diagrams (A, B, C) depicting node-based systems with directional arrows. Each diagram shares core nodes (X, A, Y, B, C, Z) but varies in connection patterns and arrow types. The diagrams use color-coded arrows (blue, green, black) to differentiate relationships, though no explicit legend is provided.
### Components/Axes
- **Nodes**:
- **X** (light blue circle)
- **A** (yellow triangle)
- **Y** (gray triangle)
- **B** (yellow triangle)
- **C** (yellow triangle)
- **Z** (light blue circle)
- **Arrows**:
- **Blue**: Unidirectional flow (e.g., X → A, C → Z)
- **Green**: Unidirectional flow (e.g., A → Y, Y → B)
- **Black**: Bidirectional flow (e.g., A ↔ Y in Diagram B)
- **Spatial Layout**: Nodes arranged in a circular pattern, with arrows connecting them in sequential or branching paths.
### Detailed Analysis
#### Diagram A
- **Flow Path**: X → A → Y → B → C → Z → X (closed loop).
- **Key Connections**:
- All arrows are unidirectional (blue/green).
- No direct connection between X and Y or B and Z.
#### Diagram B
- **Flow Path**: X → A ↔ Y → B → C → Z → X (closed loop with bidirectional A-Y).
- **Key Connections**:
- Bidirectional arrow (black) between A and Y.
- Maintains the closed loop structure but introduces mutual interaction between A and Y.
#### Diagram C
- **Flow Path**: X → B → C → Z → X (partial loop) and A → Y (isolated pair).
- **Key Connections**:
- Missing A-Y connection from Diagrams A/B.
- Direct arrow (blue) from X to B, bypassing A.
- A and Y form an isolated pair with no incoming/outgoing connections to the rest of the system.
### Key Observations
1. **Diagram A** represents a fully connected cycle with unidirectional flow.
2. **Diagram B** introduces a bidirectional relationship (A-Y), suggesting mutual dependency or feedback.
3. **Diagram C** disrupts the cycle, creating a fragmented system where A-Y operates independently, and X-B-Z form a smaller loop.
### Interpretation
The diagrams likely model different network topologies or process flows:
- **Diagram A** could represent a linear workflow with strict sequential dependencies.
- **Diagram B** implies a system where certain components (A and Y) interact bidirectionally, enabling feedback or redundancy.
- **Diagram C** suggests a hybrid structure where critical nodes (A, Y) are decoupled from the main flow, potentially indicating fault tolerance or modular design.
**Uncertainties**:
- The absence of a legend leaves the meaning of arrow colors open to interpretation (e.g., blue vs. green distinctions).
- No numerical data or labels quantify the strength or frequency of connections, limiting quantitative analysis.
**Peircean Insight**:
The progression from A to C highlights how structural changes (e.g., adding/removing connections) alter system behavior. Diagram C’s isolation of A-Y might reflect a scenario where specific components are intentionally decoupled to test resilience or optimize resource allocation.