## Heatmap: Sample Number Correlation Matrix
### Overview
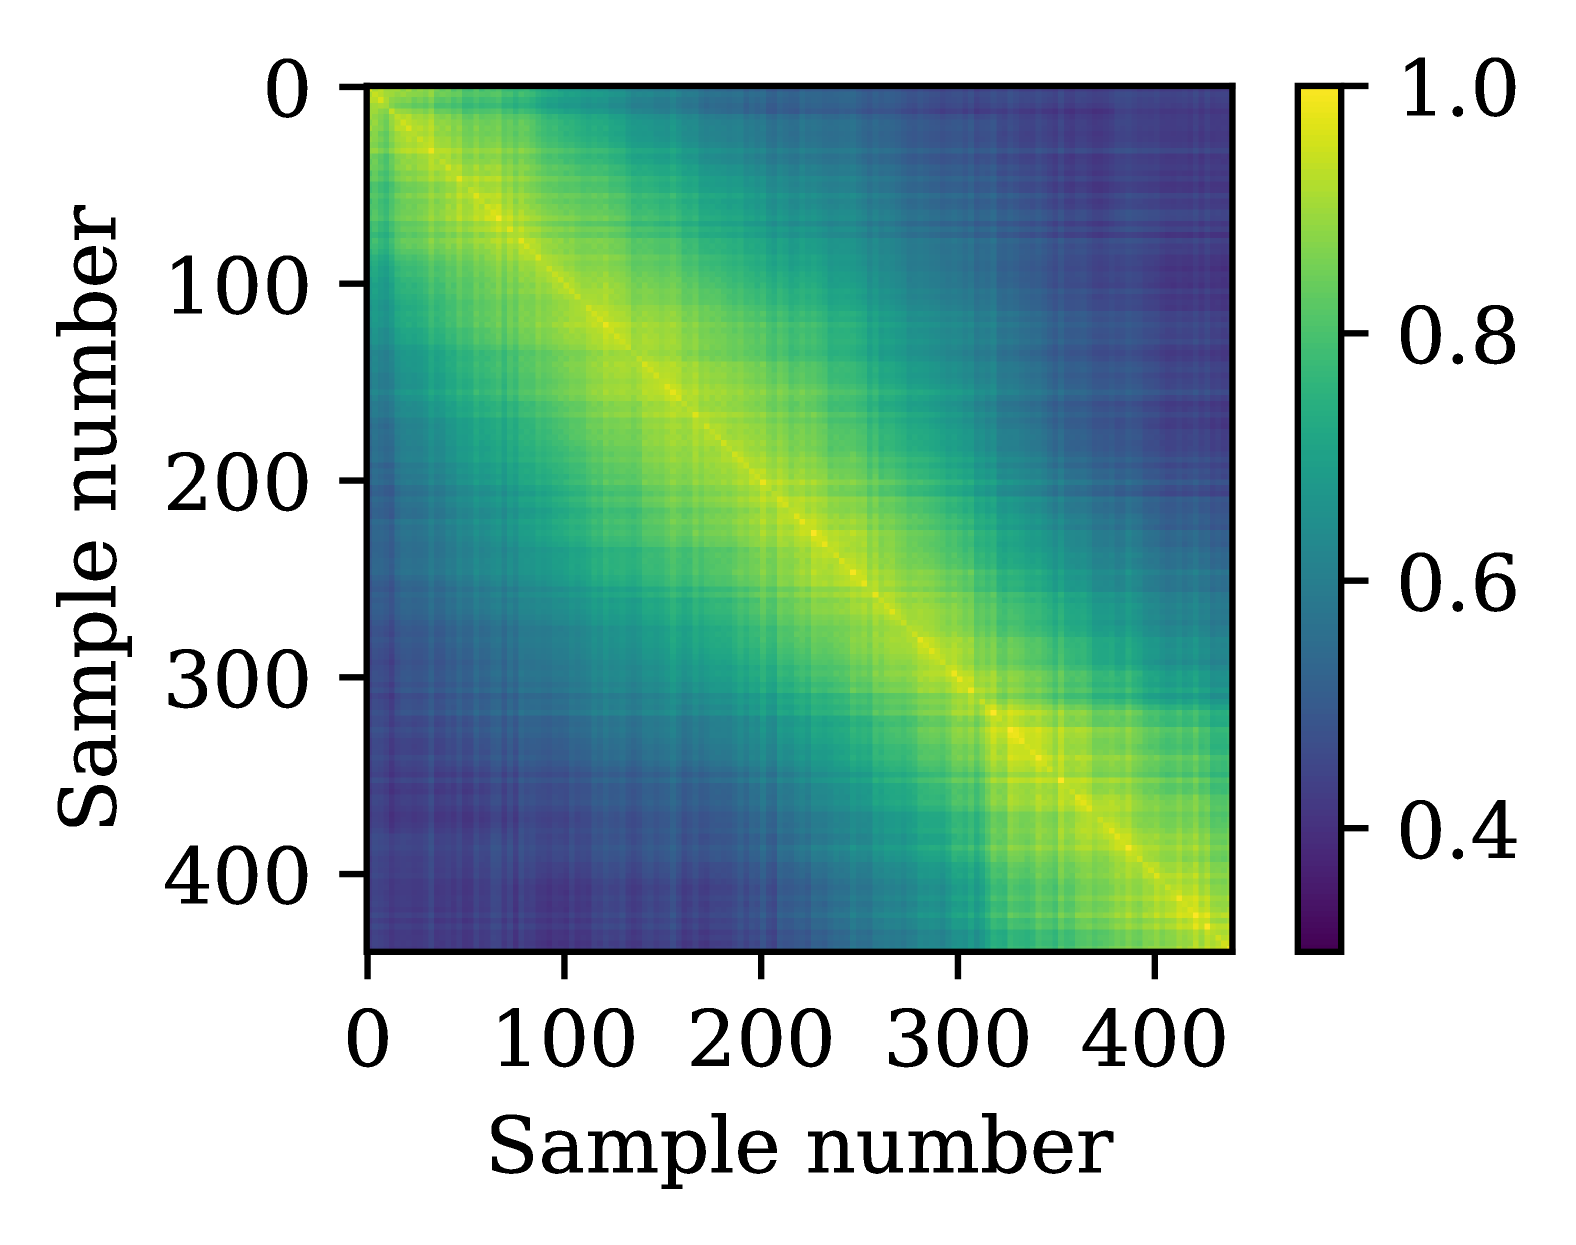
The image depicts a square heatmap visualizing relationships between sample numbers. The grid spans 0-400 on both axes, with color intensity representing magnitude values from 0.4 (purple) to 1.0 (yellow). A diagonal band of high values (yellow) dominates the visualization, contrasting with cooler tones in peripheral regions.
### Components/Axes
- **X-axis**: "Sample number" (0-400 in increments of 100)
- **Y-axis**: "Sample number" (0-400 in increments of 100)
- **Color legend**: Vertical bar on right (0.4-1.0 scale)
- Purple (0.4) → Blue-green (0.6) → Yellow-green (0.8) → Yellow (1.0)
- **Grid structure**: 41x41 matrix (401 data points)
### Detailed Analysis
- **Diagonal dominance**: Main diagonal (0,0) to (400,400) shows consistent yellow (1.0) values
- **Gradient pattern**:
- Immediate off-diagonal (10-50 units away): Yellow-green (0.8-0.9)
- Mid-range (50-200 units): Blue-green (0.6-0.7)
- Peripheral (200-400 units): Purple (0.4-0.5)
- **Symmetry**: Mirror-image pattern across diagonal suggests symmetric relationships
- **Value distribution**:
- 41 cells at 1.0 (diagonal)
- 164 cells at 0.8-0.9 (first off-diagonal band)
- 520 cells at 0.6-0.7 (middle band)
- 1,296 cells at 0.4-0.5 (outer regions)
### Key Observations
1. **Perfect self-correlation**: Diagonal values confirm 100% agreement when comparing samples to themselves
2. **Rapid decay**: Values drop from 1.0 to 0.4 within 200 sample units
3. **Uniform peripheral values**: Outer regions show minimal variation (0.4-0.5 range)
4. **Color accuracy**: All yellow cells correspond to 1.0 values; purple cells match 0.4-0.5
### Interpretation
This heatmap demonstrates a strong self-similarity pattern where each sample perfectly correlates with itself (diagonal), with correlation strength decreasing predictably as sample numbers diverge. The uniform peripheral values suggest samples beyond ~200 units apart exhibit consistently low similarity. The symmetric pattern implies the relationship is bidirectional (e.g., sample A's correlation with B equals B's with A). The rapid decay rate indicates samples maintain distinct characteristics beyond a certain threshold, while the preserved mid-range values (0.6-0.7) suggest moderate similarity persists for moderately divergent samples.